API Asset Details
The full API details page displays everything Panoptica can tell you about any asset in your API inventory. You reach this page by navigating to the API Security tab under Workloads & Data, and selecting any item in the All API Assets table. Click the API name to pop up the high-level overview in a side window. Click Open a Full Details Page at the bottom of the pop-up window to reach the details page of the API you selected.
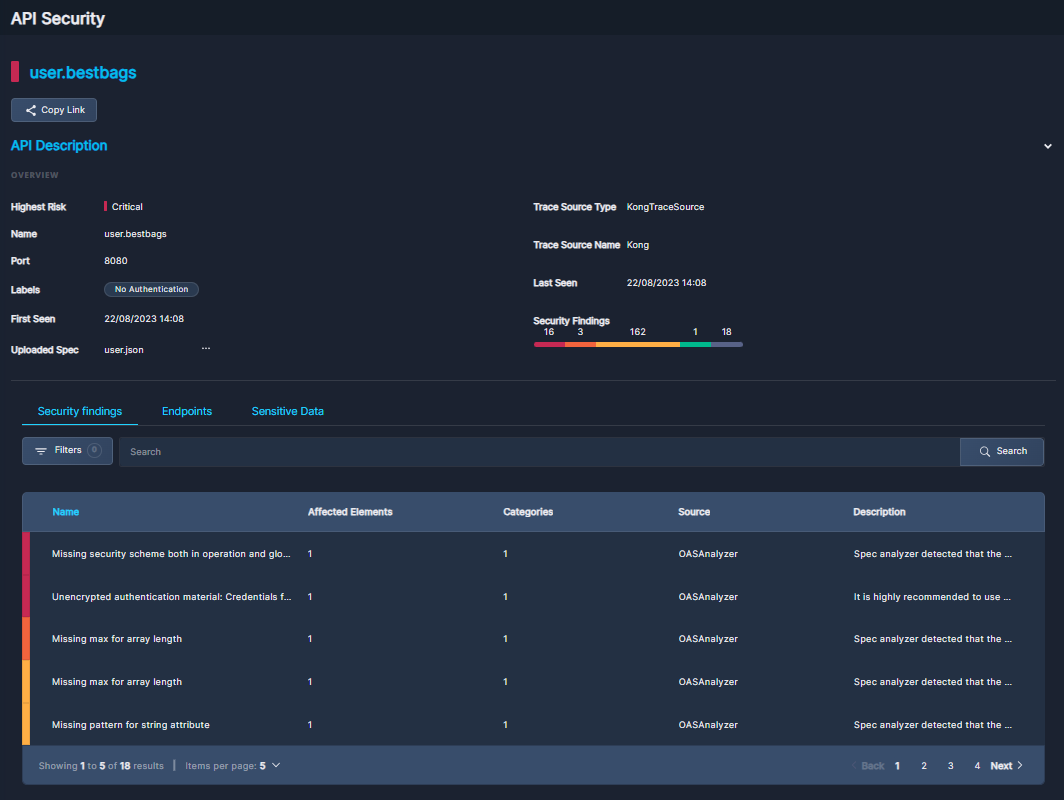
Click Copy Link to save a URL to this detail view. This is useful for recording the details, or sharing this information with others.
Under API Description, you'll find most of the same information you saw on the pop-up overview window: risk severity, trace source information, port number, specs, when it was observed, etc.
If there is no OpenAPI Specification, click the three dots (•••) to the right of Uploaded Spec to add one.
If there is already an OpenAPI Specification uploaded, click the three dots (•••) to replace it, delete it, or view it in Swagger.
The three subtabs below the API Description—Security Findings, Endpoints, Sensitive Data— provide in-depth information regarding the selected API.
Security Findings
The Security Findings subtab displays the risks and vulnerabilities Panoptica has identified in the selected API.
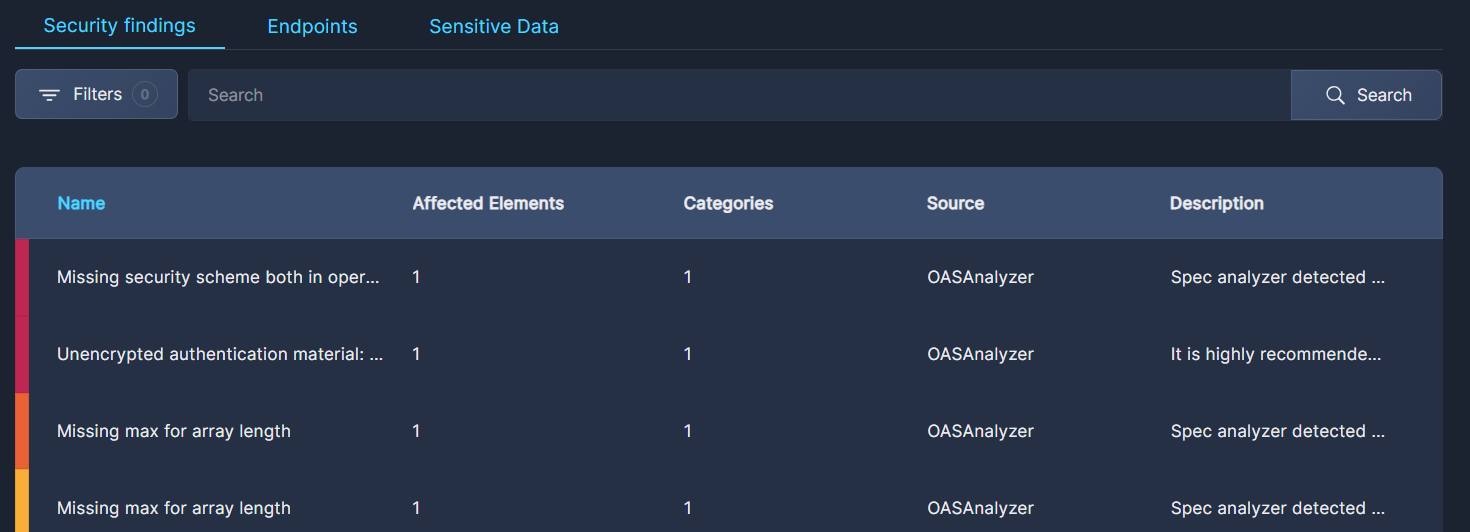
- Click the Filter button to narrow the list according to four parameters:
- Risk: Critical to Informational
- Category: Application, API Spec, Authentication, Authorization, Network, System
- Source: Third Party Scorer, OAS Analyzer, or Trace Analyzer
- Type a term from a risk name into the Search bar to find a specific risk.
To clear the search, delete any text in the field and click Search. - At the bottom of the screen you can define how many items are displayed on each page, from 5 to 100 lines.
The table displays summary data about each risk identified, including the number of affected elements, the source, and a brief description.
Click on any row in the table to pop up another side window that displays additional information about that risk.
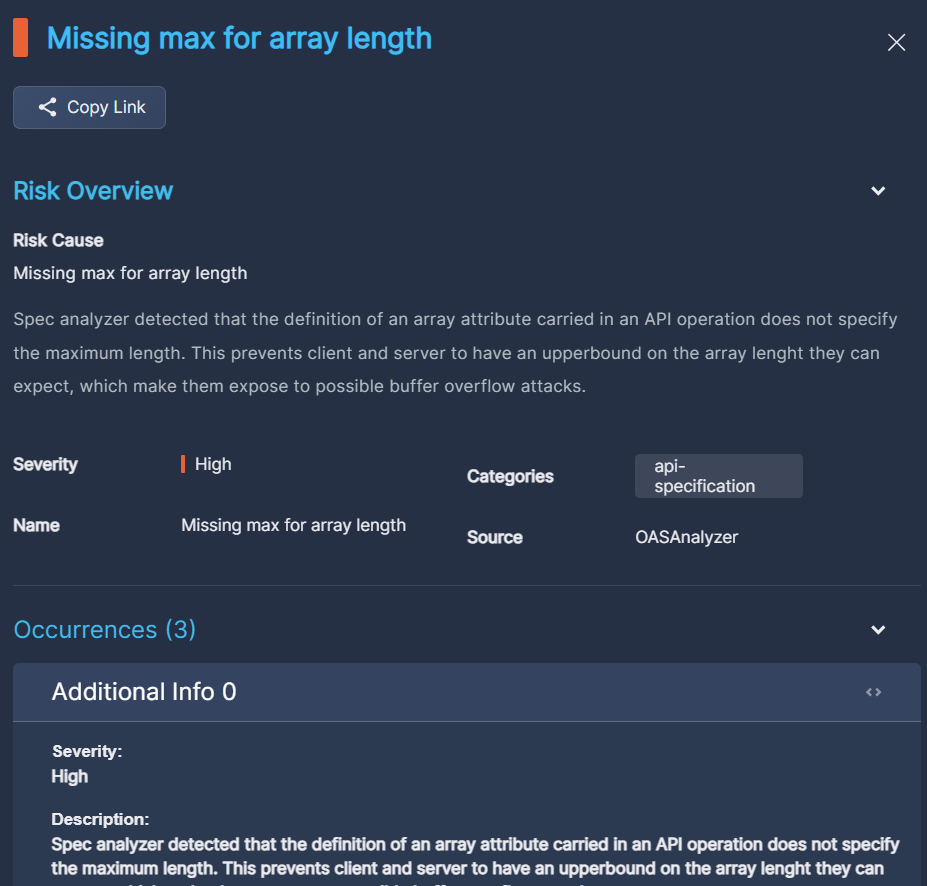
- Click Copy Link to save a URL to this view. This is useful for recording the details or sharing this information with others.
- Under Risk Overview, you'll find a more detailed description of the risk cause, as well as a severity ranking and any categories this risk might fall into.
- Expand Occurrences to find details of every incidence of this finding in the API you're exploring.
Endpoints
The Endpoints subtab displays all of the endpoints Panoptica has discovered in the selected API.
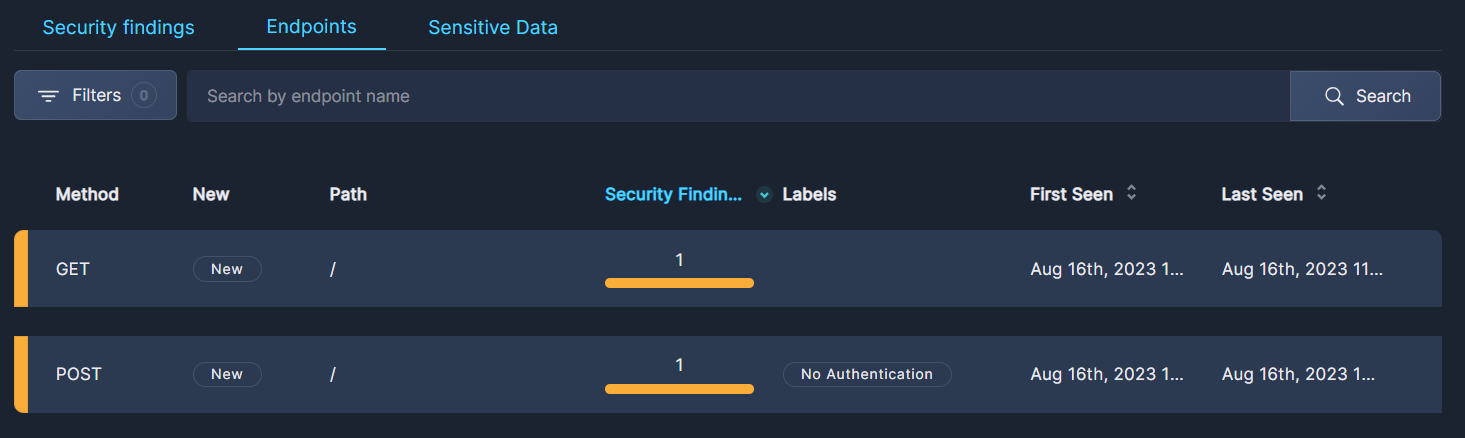
- Click the Filter button to narrow the list according to three parameters:
- Method: Get, Post, Put, etc.
- Labels: Sensitive Data, No Authentication
- Highlight Severity: Critical to Informational
- Type an endpoint name into the Search bar to find a specific endpoint.
To clear the search, delete any text in the field and click Search.
The table displays summary data about each endpoint in the selected API, including the path, and labels that might be associated with the each endpoint, and when it was recorded.
Click any endpoint in the list to open the Endpoint Details page.
Endpoint Details
The Endpoint Details screen enables you to dive deeper into the request parameters, response attributes, access control posture, and security findings of the endpoints in your APIs.
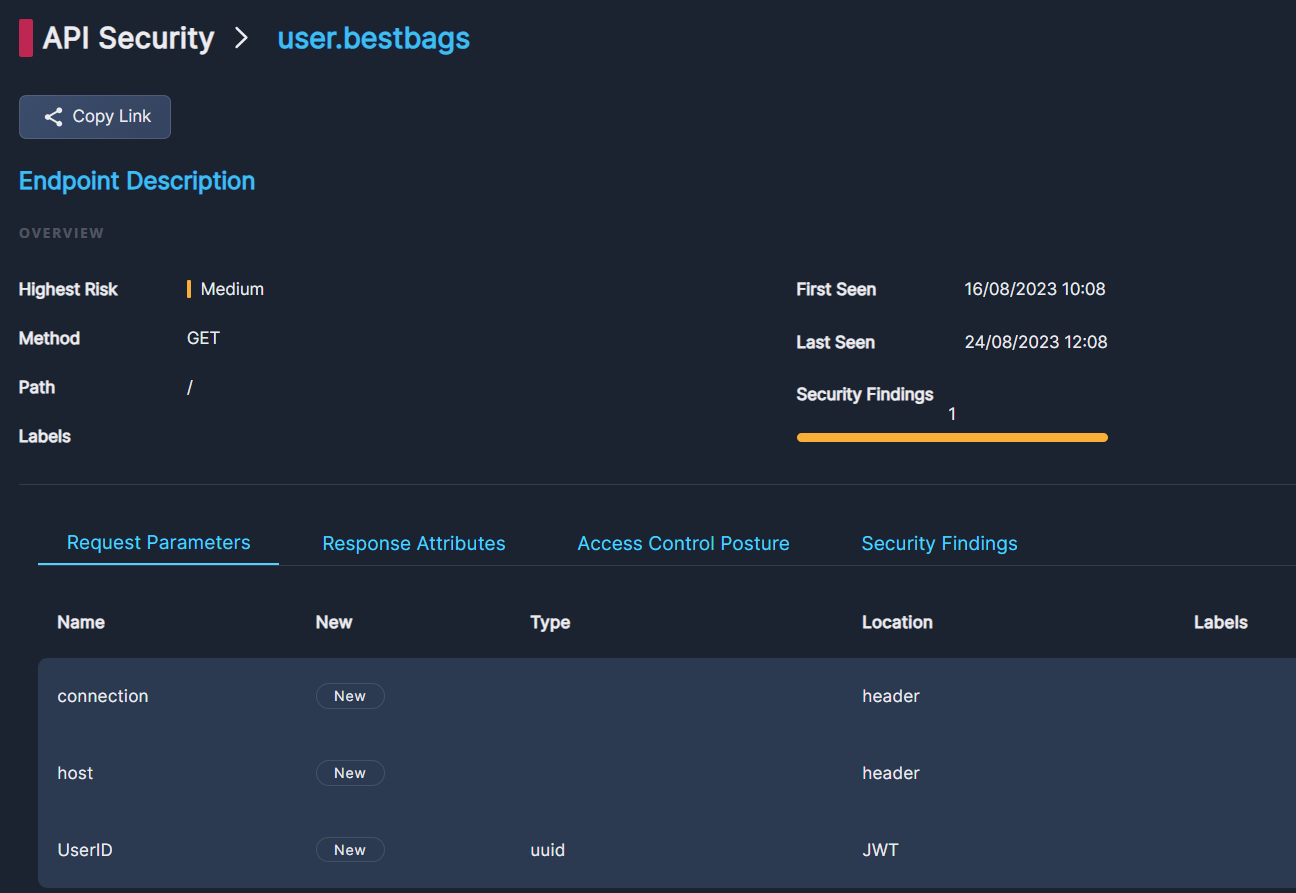
- Click Copy Link to save a URL to this view. This is useful for recording the details or sharing this information with others.
- Under Endpoint Description, you'll find essentially the same information you saw in the Endpoints table in the previous screen.
The four subtabs below provide more granular data regarding the endpoint you selected. Click each subtabs to view details regarding Request Parameters, Response Attributes, Access Control Posture, and Security Findings.
Request Parameters
This tab shows the parameters of the requests to the endpoint:
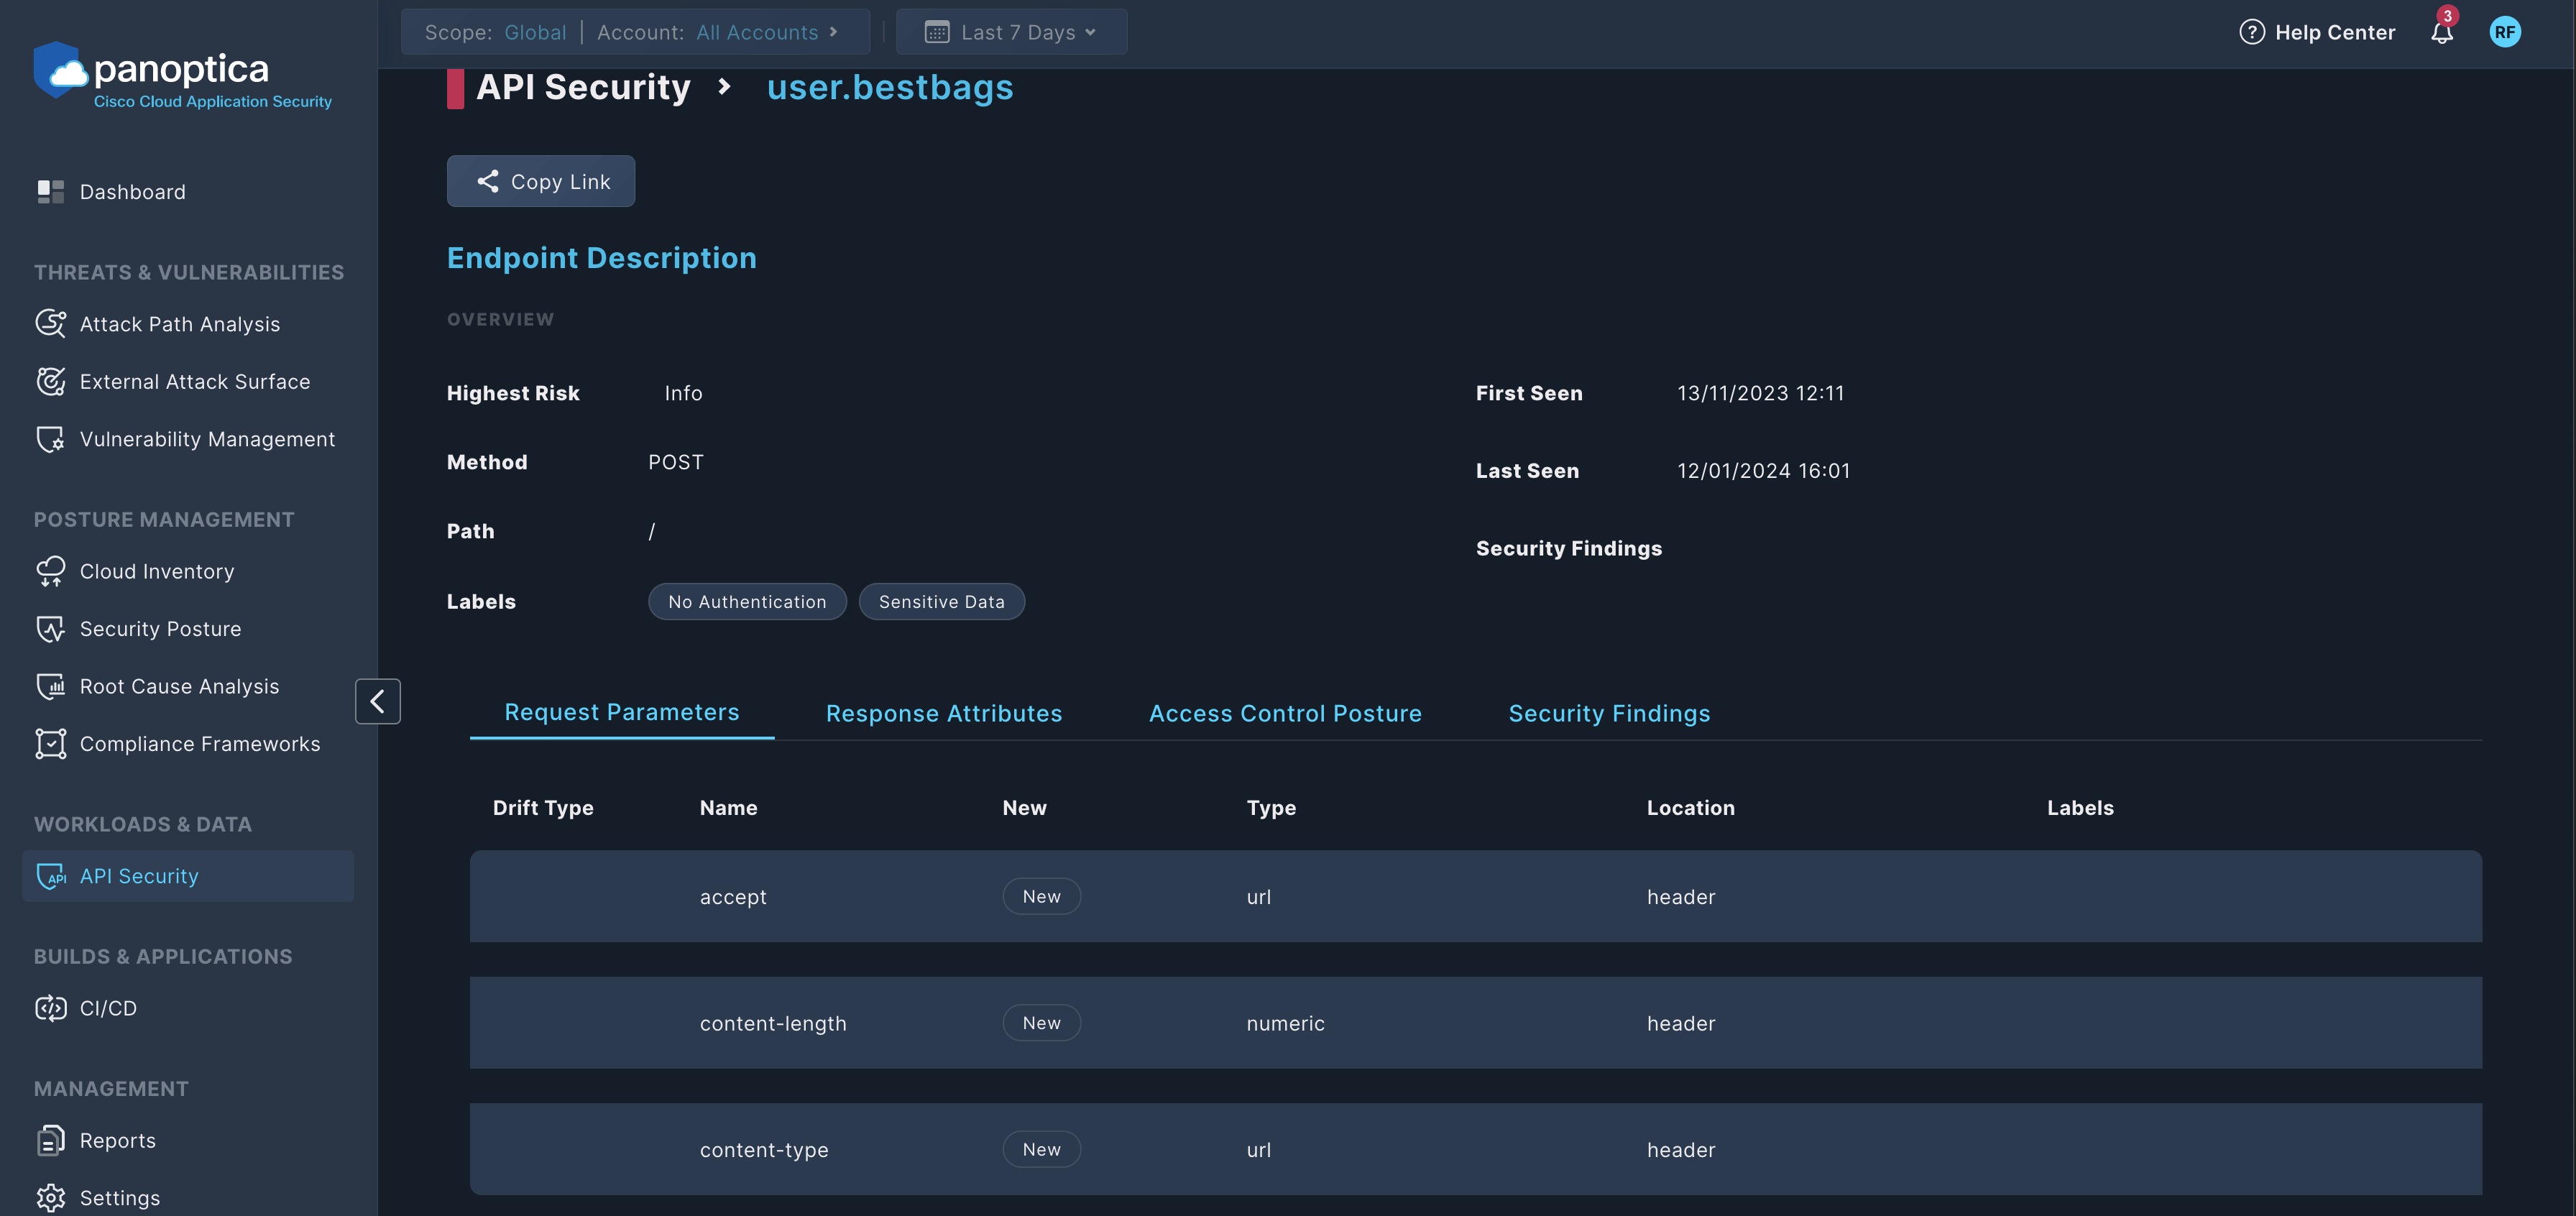
- Drift Type: Shows if Panoptica has detected a drift in the traffic compared to the OpenAPI specification (OAS) of the endpoint.
- Name: The name of the parameter, for example,
content-lengthorcontent-type. - Type: The type of the parameter, for example,
url, orurluuid. - Location: The location of the parameter, for example,
headerorurl. - Labels: The labels of the endpoint.
Response Attributes
This tab shows the attributes of the responses from this endpoint:
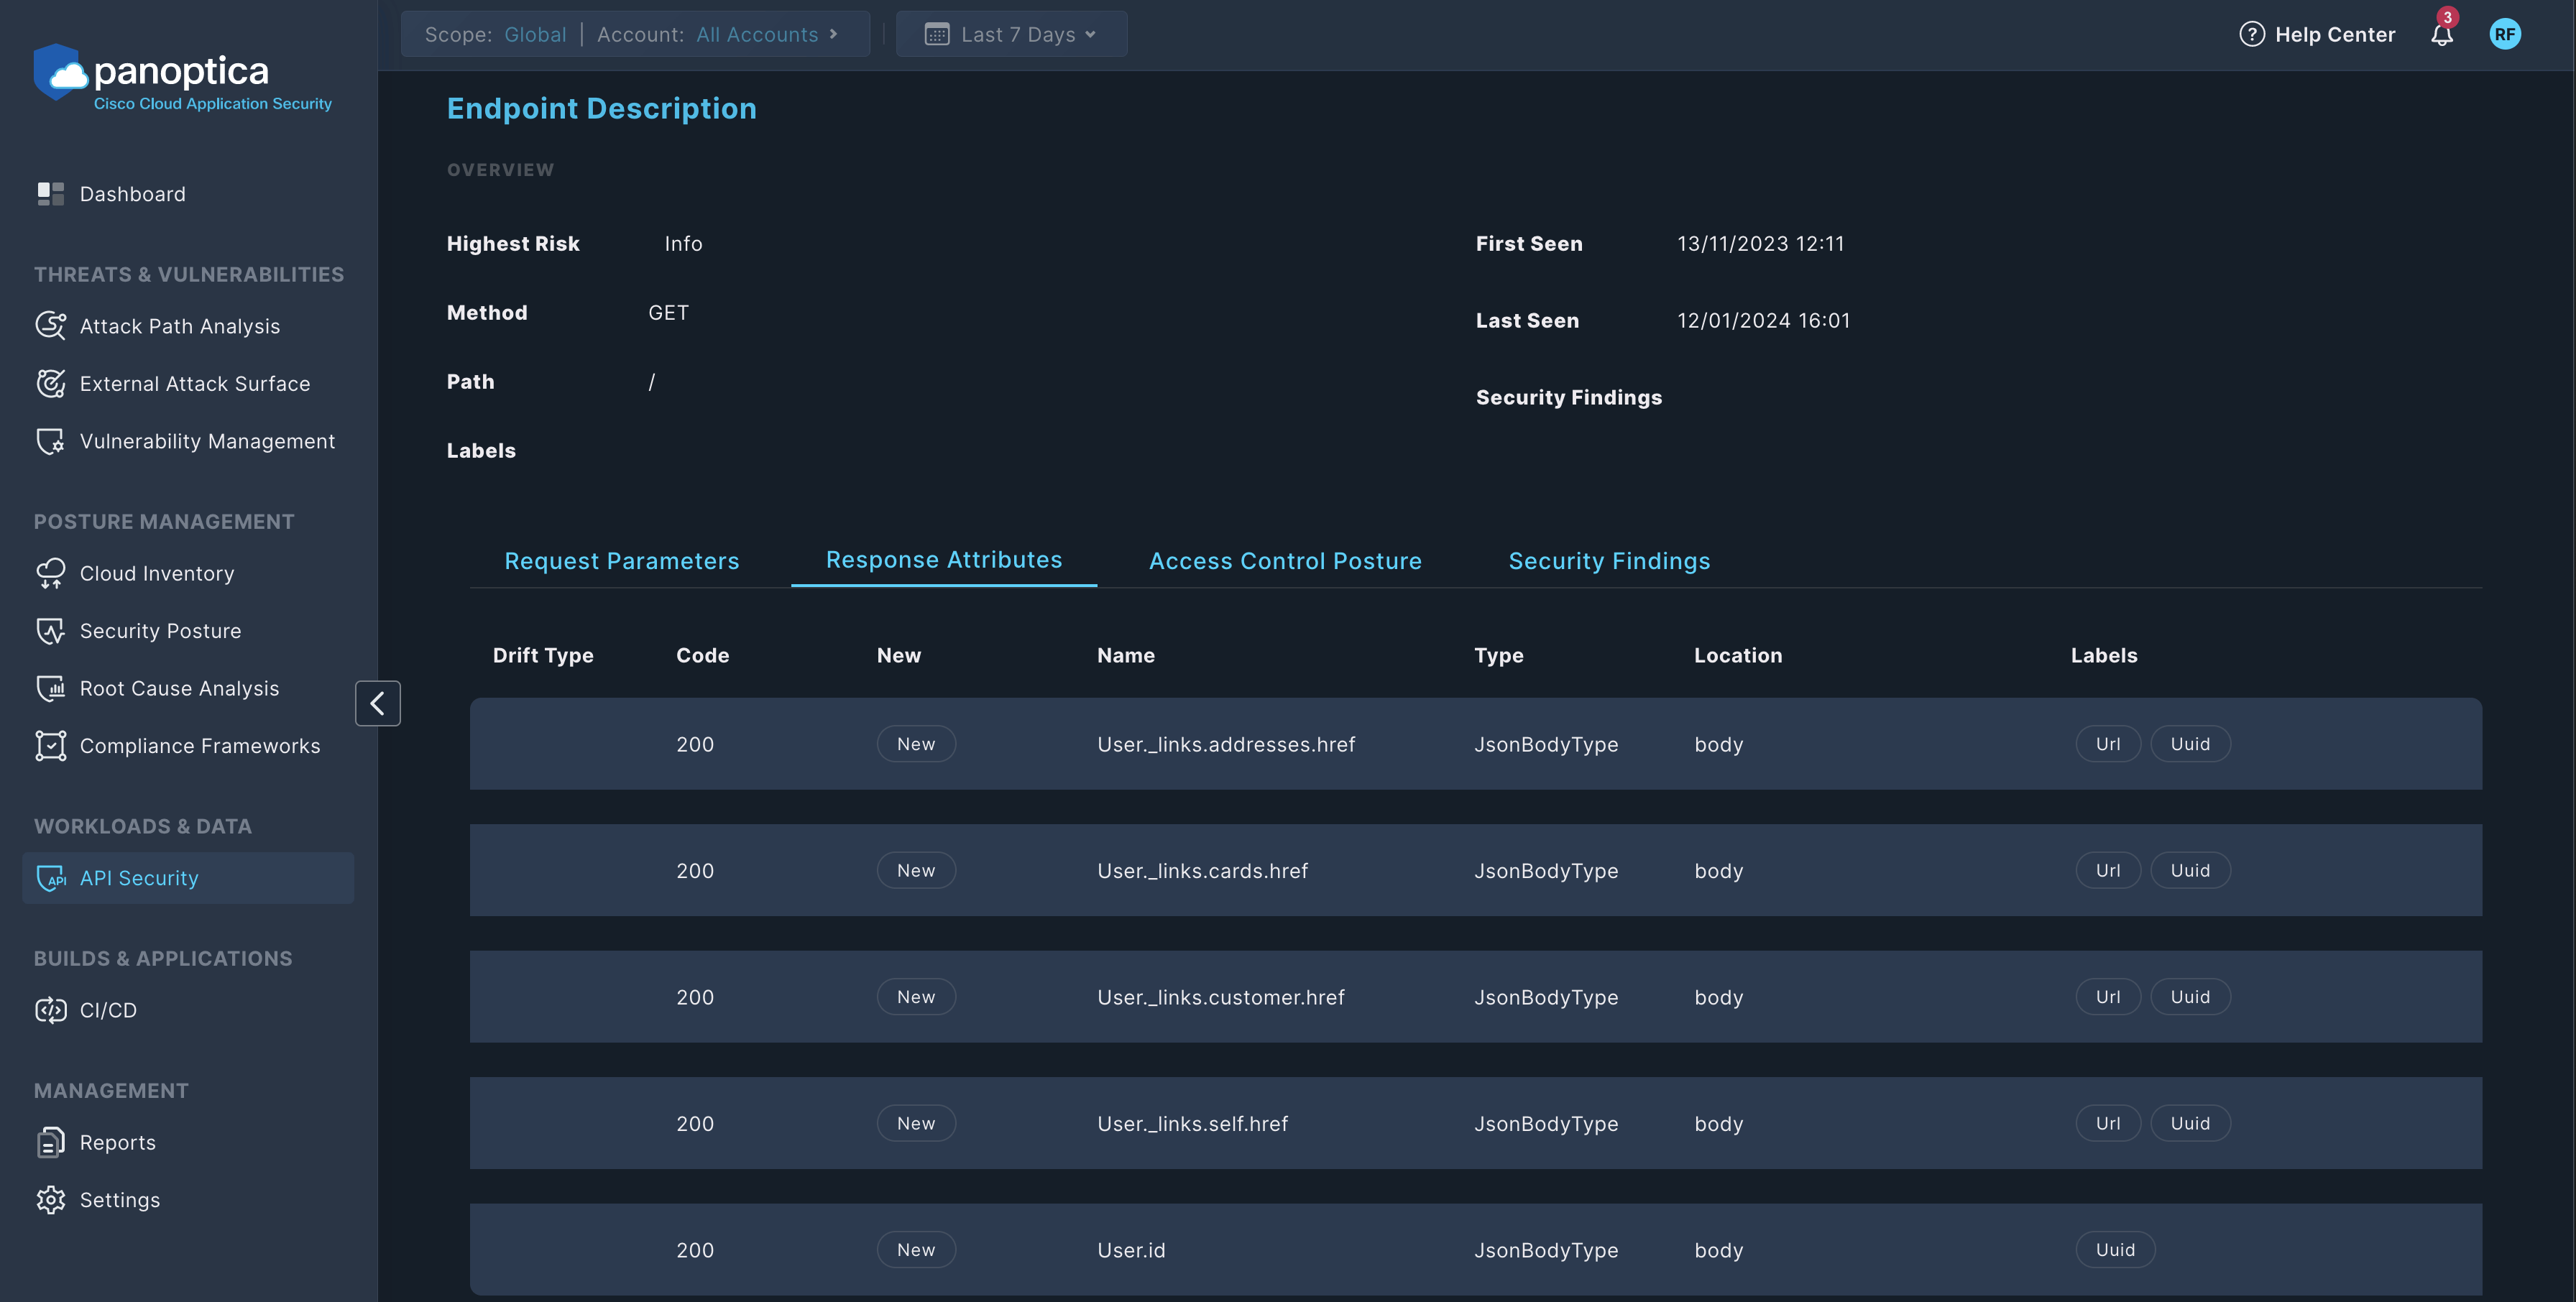
- Drift Type: Shows if Panoptica has detected a drift in the traffic compared to the OpenAPI specification (OAS) of the endpoint.
- Code: The HTTP status code, for example, 200.
- Name: The name of the response attribute.
- Type: The type of the response attribute.
- Location: The location of the response attribute, for example,
body. - Labels: The labels of the endpoint.
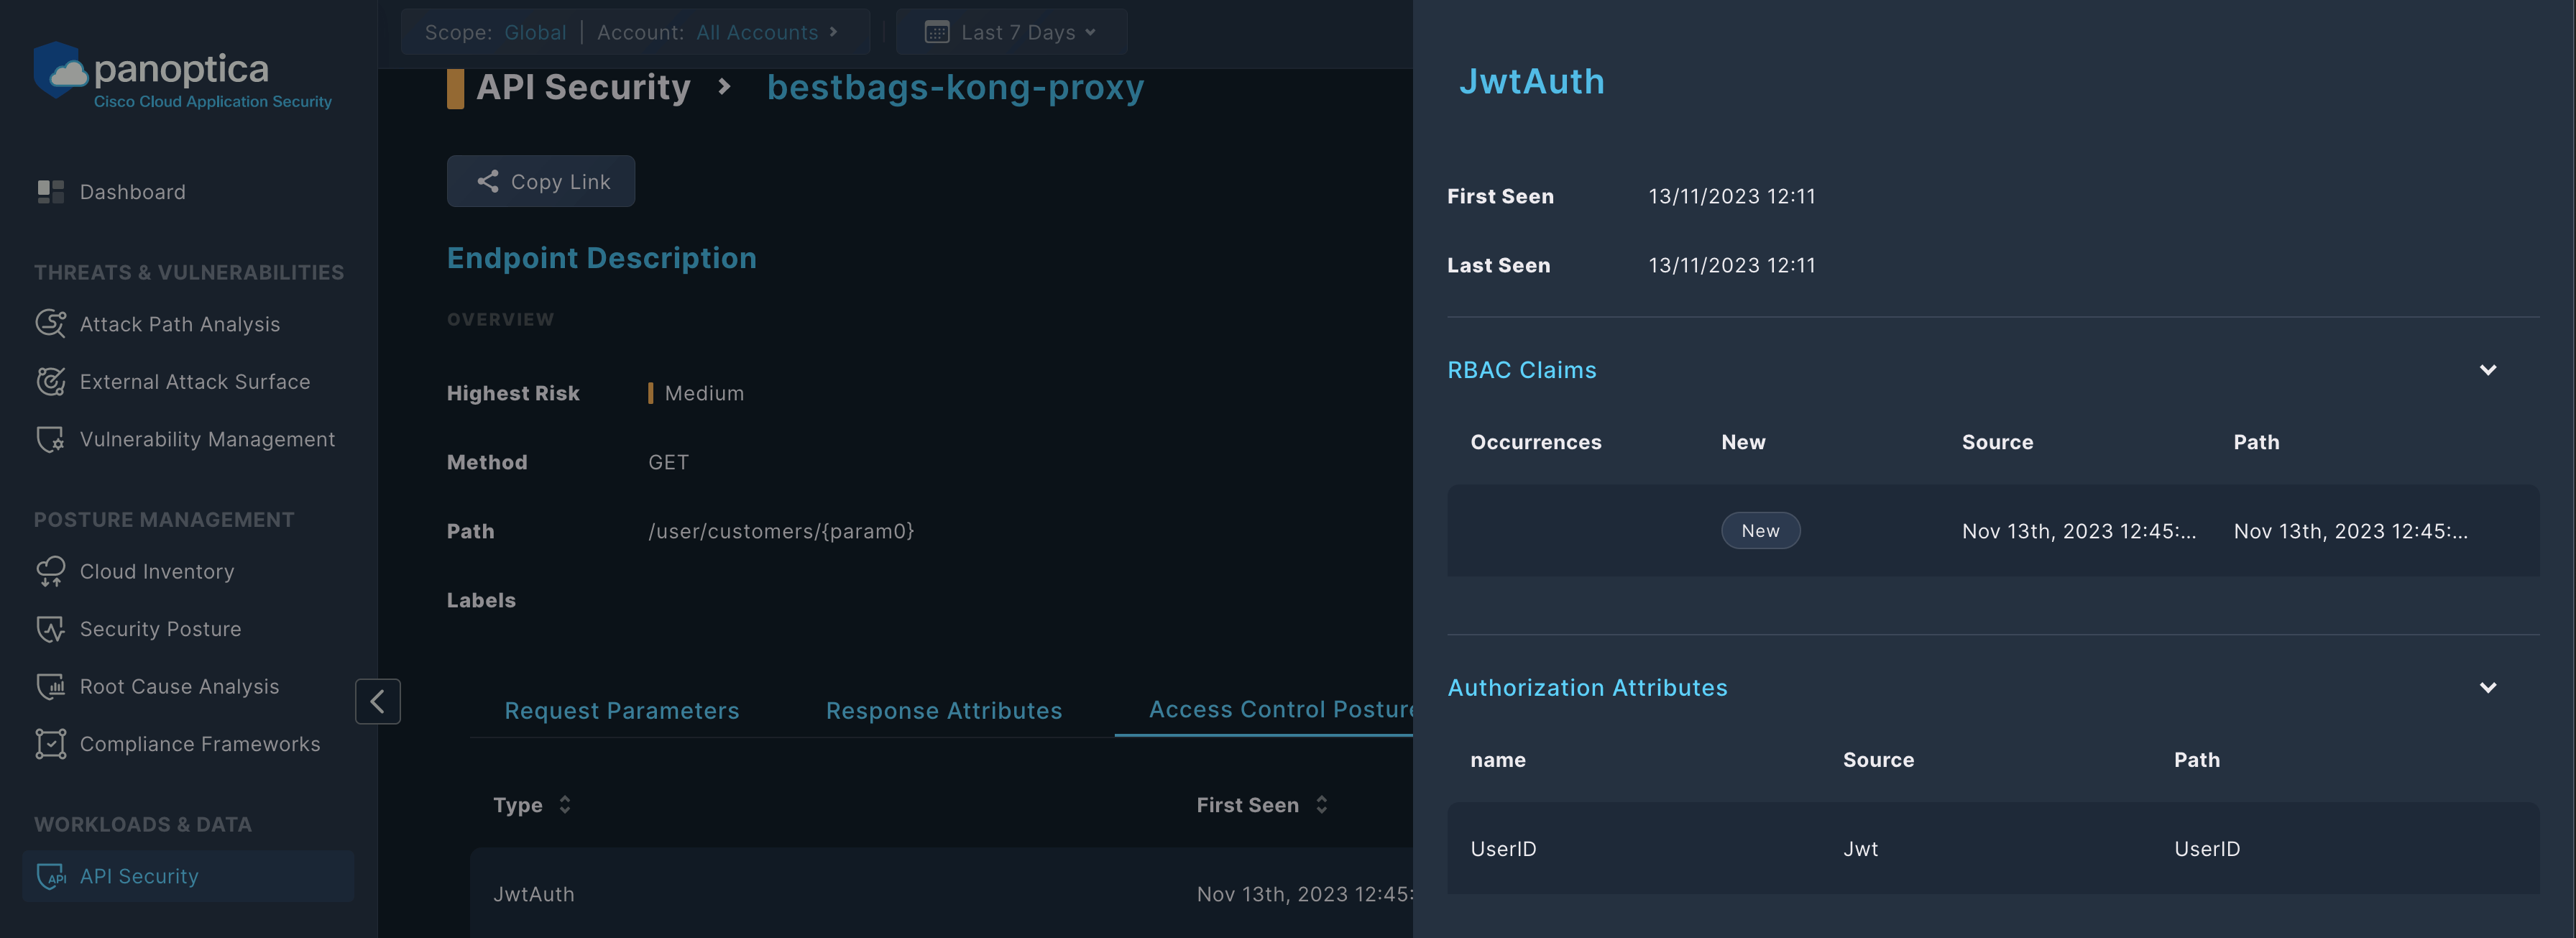
Access Control Posture
This tab shows authentication and access control related information about the endpoint, for example, the Type of authentication required for the endpoint (such as BasicAuth or JwtAuth).
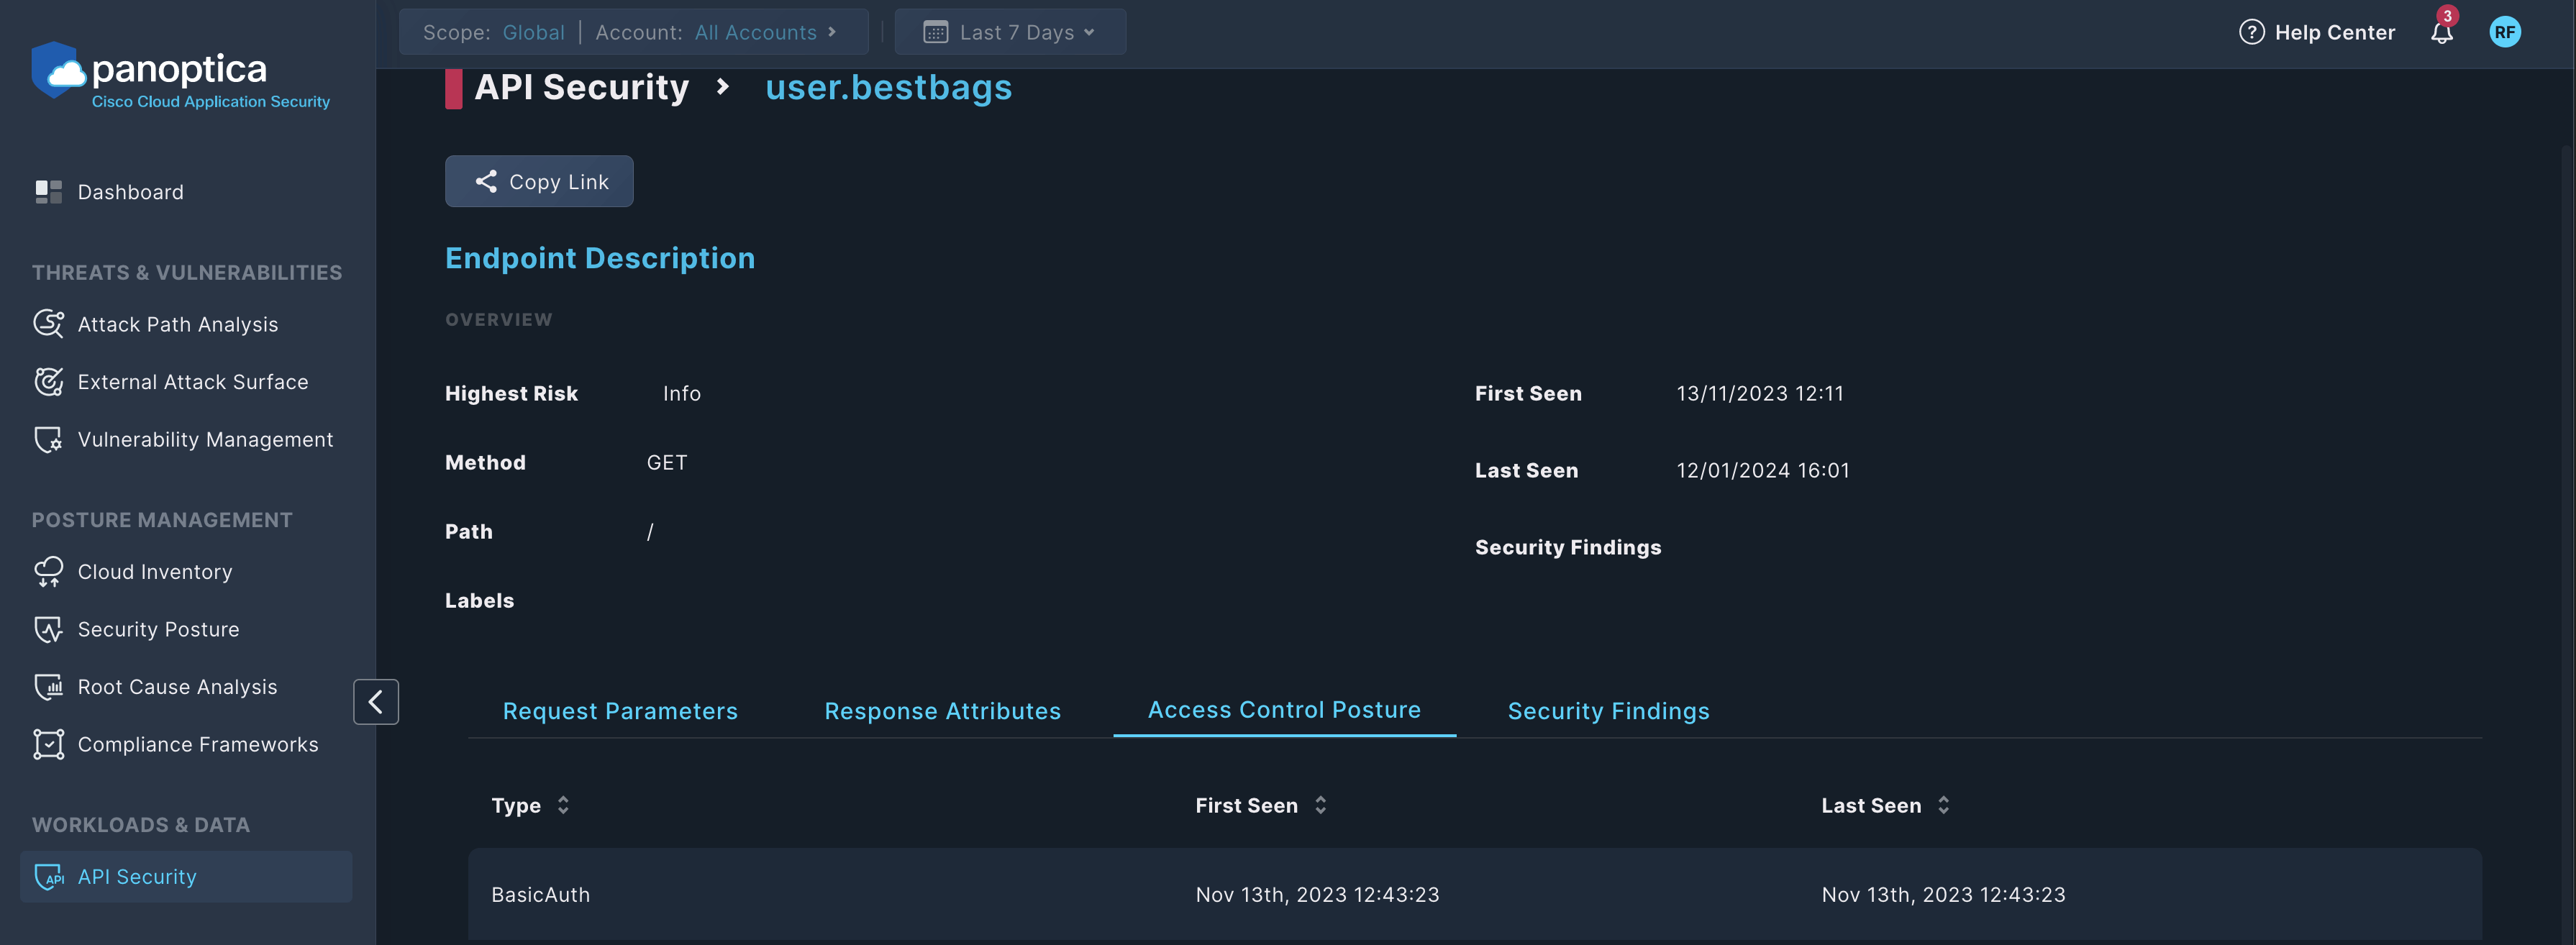
Click on an item to see its details, including RBAC Claims and Authorization Attributes.
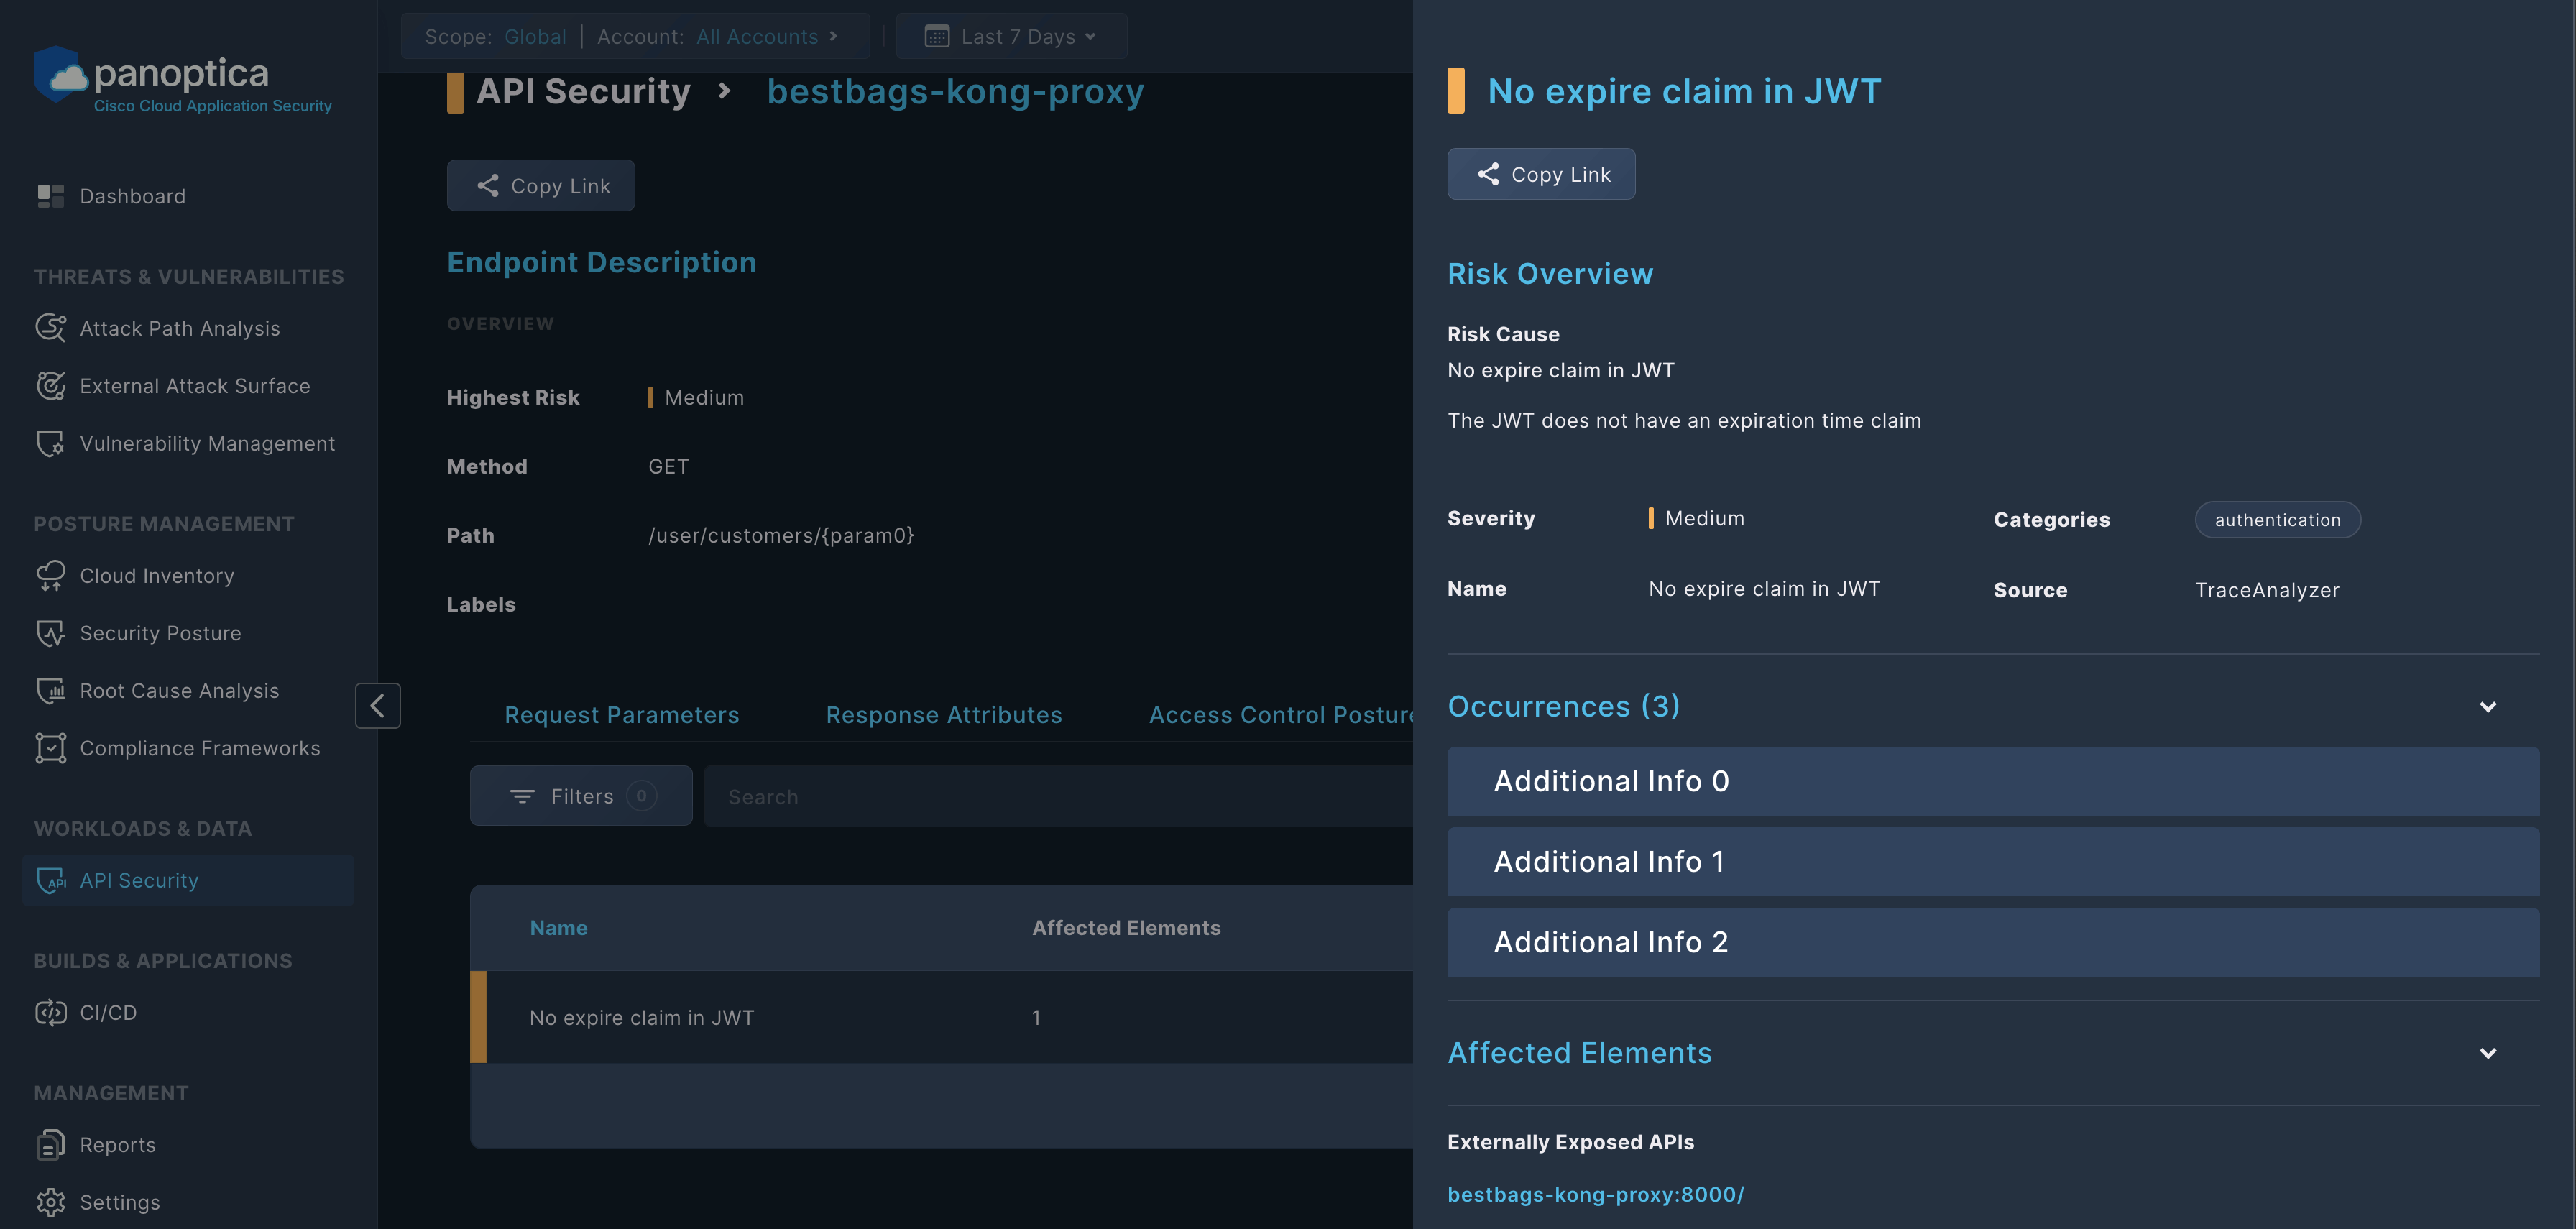
Security Findings
This tab shows the security findings related to the endpoint, for example, the findings of the OpenAPI specification analyzer.
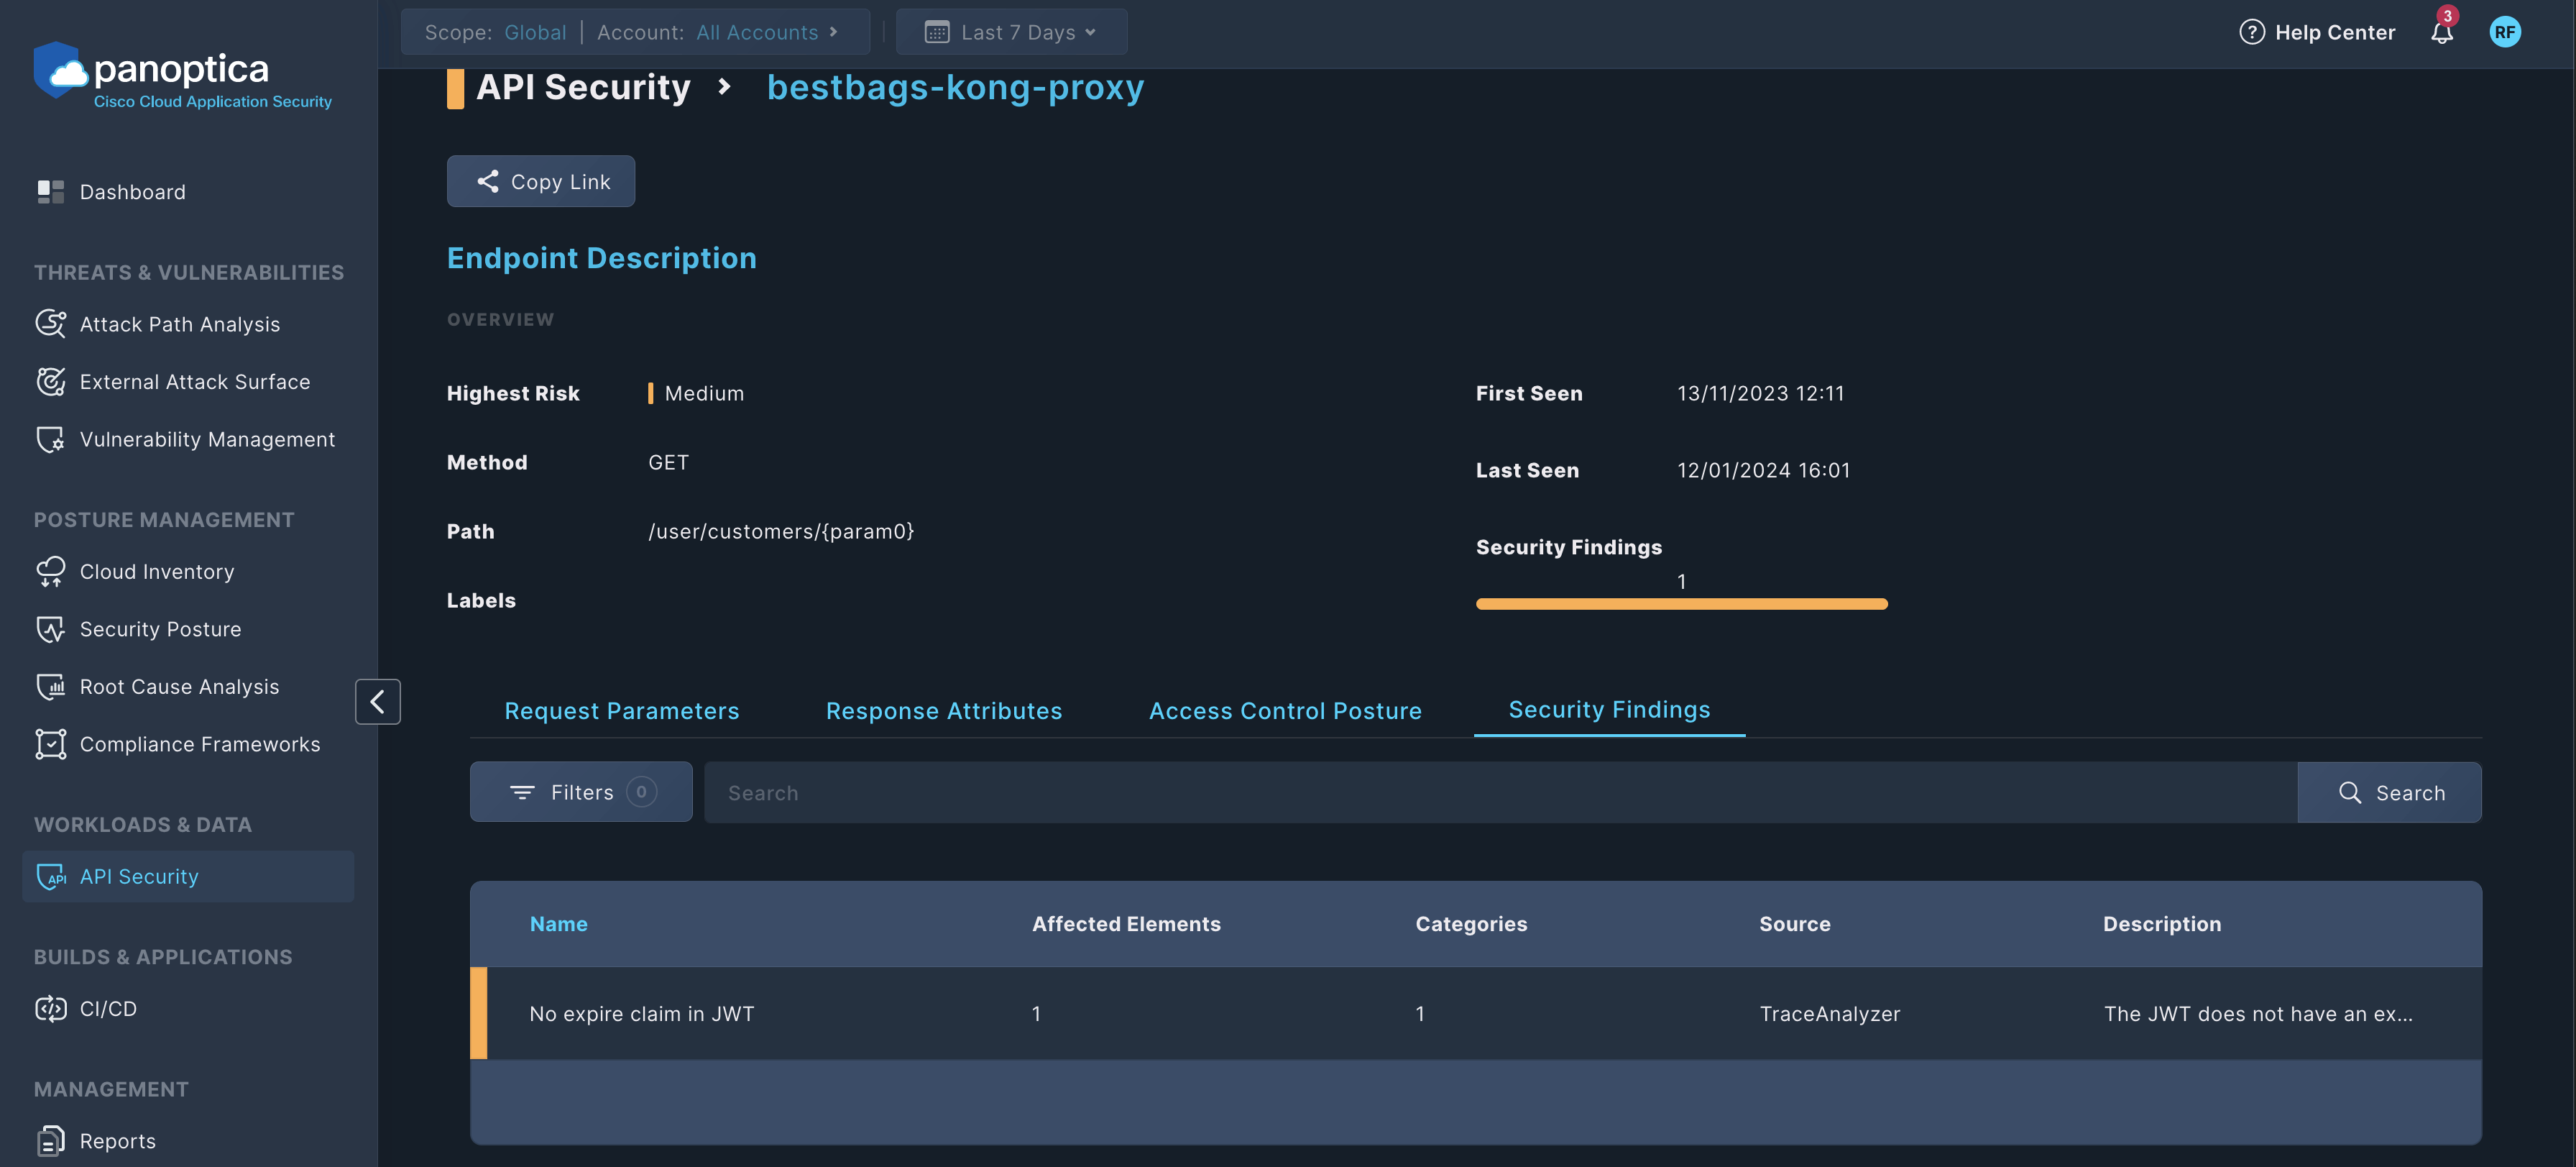
Click on an item to see its details, including the Risk Overview of the finding and the Affected Elements.
Sensitive Data
The Sensitive Data subtab displays information regarding any personally identifiable information (PII), financial data, IP addresses, etc. that Panoptica has discovered in the selected API.
Note that the sensitive data itself does not appear in Panoptica, only information regarding what type of data was found, where, and when.
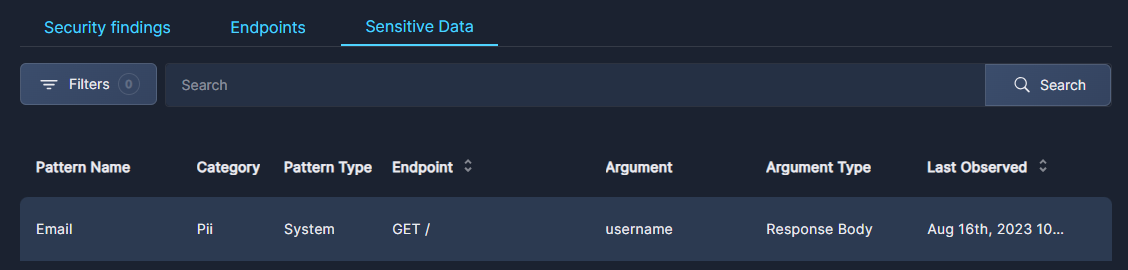
- Click the Filter button to narrow the list according to two parameters:
- Category: Sensitive Data, No Authentication
- Pattern Type: System or Custom
- Type an endpoint name into the Search bar to find a specific endpoint.
To clear the search, delete any text in the field and click Search.
To learn about how Panoptica helps secure sensitive data in your APIs, see Sensitive Data.
Updated 10 months ago