Smart CDR
Smart Cloud Detection and Response (CDR) goes beyond traditional platform protection by bringing your security measures into the here and now. Sometimes called CNDR, a CDR engine can collect events as they happen, analyze them using machine learning algorithms, and issue realtime alerts to keep your security teams informed.
Integrating Panoptica's CDR data collector into your Kubernetes environment provides K8s runtime protection based on Falco 0.36. Once you've deployed the controller, you can view a "live feed" of the suspicious activity, and configure realtime alerts via the channel of your choice, according to severity levels that you configure.
Onboarding
Panoptica's CDR Controller is deployed together with the Kubernetes Controller.
Select Settings in the navigation pane, then the Accounts tab. Choose Kubernetes, and follow the on-screen steps. Under Preferences, select CDR to add it to your deployment. See Kubernetes Controller Onboarding for details.
View activity
Go to the Smart CDR tab under Threats & Vulnerabilities to view, filter, search, and monitor live activity in your Kubernetes environment.
Filter and search
You can refine the results using predefined filters and custom queries:
- Use the drop-down Filter option to narrow the results by: Dismissed, Time Range, Rule Names, Severity, and Clusters.
- Use the Search bar to look for a text string in a rule name. To reset the search, click the "X"
Time Range requiredNote that a Time Range filter is always required. You can change it using the Filters button, but you cannot remove it.
The global Top Bar filters – Scope, Account, and Time Range – are inactive in Smart CDR.
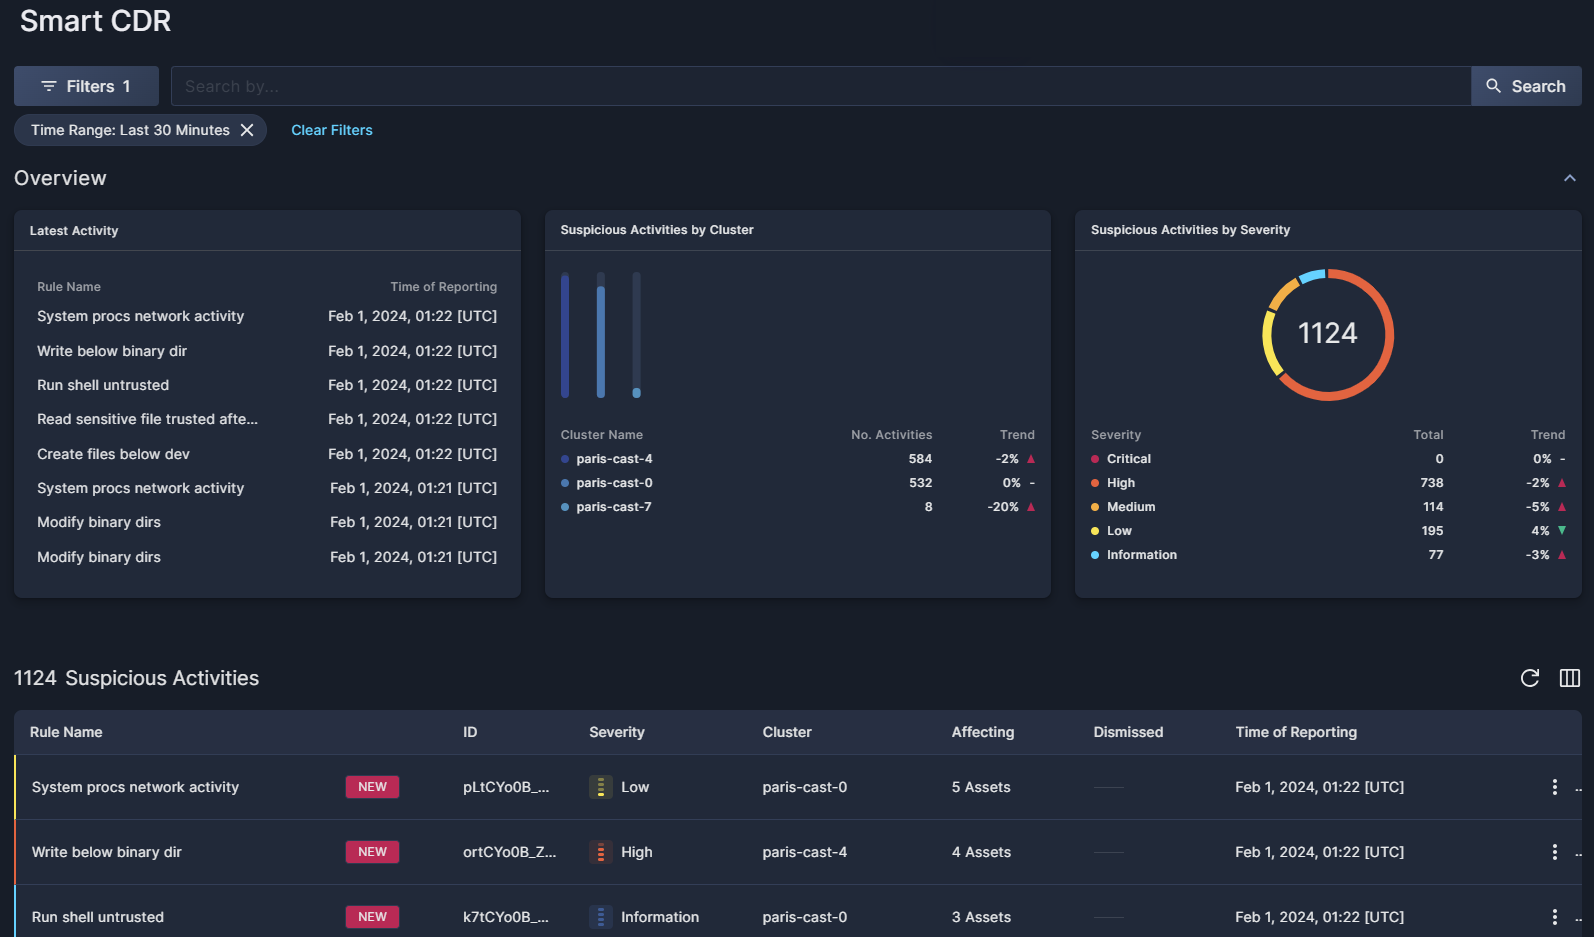
Overview
The three widgets in the Overview section present a snapshot view of the suspicious activity detected in your environment.
- Latest Activity displays the most recent activity discovered by the smart sensors, aggregated by rules.
- Suspicious Activities by Cluster displays the level of suspicious activity observed in each cluster, along with trends.
- Suspicious Activities by Severity displays a breakdown of the suspicious activity observed according to severity, from Critical to Information.
Suspicious Activities table
Below the widgets, Panoptica lists all of the suspicious activity observed in your environment in real time, filtered according to your settings. The table can be sorted by: Rule Name, ID, Severity, and the Time it was discovered.
- Click the circle-arrow icon at the top of the table (↻) to refresh the table, without the need to refresh the whole page.
- Click the Arrange Columns icon at the top of the table (▥) to select which columns to display, and in which order.
Click the three dots (⁝) at the end of each line to open a drop-down list of actions you can perform on that activity:
- Click Dismiss to acknowledge the activity, and hide it from future scans.
- Click Copy Link to retrieve a URL of a page displaying these details, and more.
If you have a large number of repositories, you can configure how many are displayed on each page. This option appears at the bottom of the table.
Suspicious activity details
Click any row in the Suspicious Activities table to pop up an overlay that displays additional details about that finding.
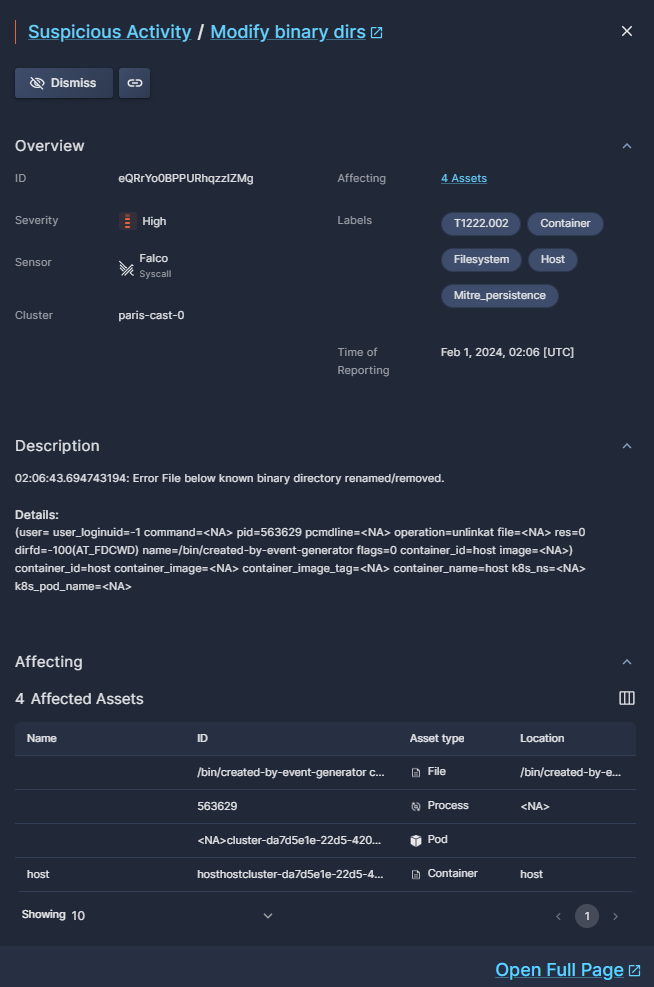
The buttons at the top of the overlay window enable specific actions on that finding:
- Click Dismiss to acknowledge the activity, and hide it from future scans.
- Click Copy Link to retrieve a URL of a page displaying these details.
The Overview provides additional details about the rule selected, in addition to those displayed in the table, such as the sensor that discovered the activity and labels.
The Description provides a verbal depiction of the suspicious activity, as well as details about the risk.
Affecting lists all of the assets affected by this activity, including the asset type and its location in your environment.
Amongst the Labels you will find MITRE ATT&CK "tcodes", providing standardized industry reference regarding the risks discovered.
Click Open Full Page to open a new tab with the same details displayed in the pop-up overlay, much like the Copy Link button.
Realtime notifications
You can configure realtime alerts about the suspicious activity Panoptica detects in your environment, so you don't have to stare at this screen all day. The alerts can be delivered to whichever channel you prefer, and can be triggered according to severity levels.
Go to Alerts and Notifications in the Settings pane to configure the notifications. First set up whichever communication channel you want to use: Slack, Microsoft Teams, AWS S3 Bucket, or Webex by Cisco. See Notifications and Alerts for details.
Only after you have a channel configured, click + Create Alert to configure the notifications. Give it a good, logical name, select CDR under Event Type, and define the Minimal Severity level for your notifications: Critical, High, Medium, Low, or Information. You can create multiple alerts for different severity levels.
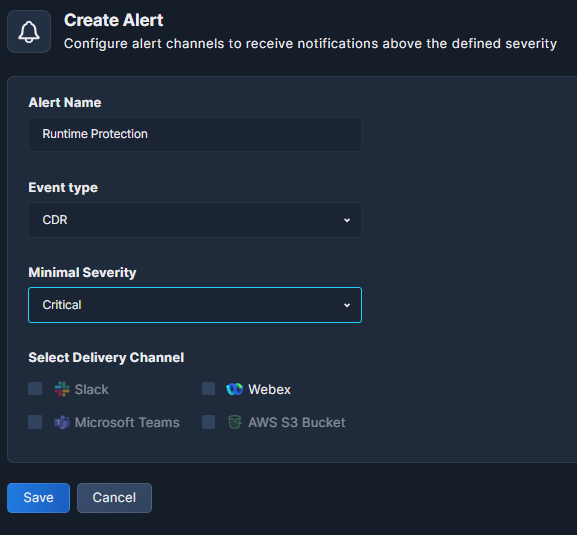
Don't forget to click Save.
Updated 10 months ago