Code Security
Panoptica's Code Security feature enables you to integrate your repositories and scan them earlier in the development pipeline for security issues. Panoptica detects Infrastructure as Code (IaC) misconfigurations, secrets, and code vulnerabilities, then assigns severity levels to the findings in order to present them in an aggregated view.
In the Panoptica console, navigate to the Code Security tab under Build and Applications to view the repositories that Panoptica is monitoring, and the security findings.
Connect Repositories
To onboard your code repositories to Panoptica, click the +Add Repository button at the top of the Code Security screen and follow the on-screen instructions.
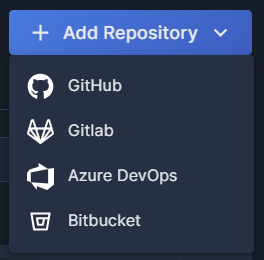
Panoptica currently supports these SCM providers:
- For detailed instructions on adding GitHub, see GitHub Integration.
- For detailed instructions on adding GitLab, including self-managed repositories, see GitLab Integration.
- For detailed instructions on adding Azure DevOps, see Azure DevOps Integration.
- For detailed instructions on adding Bitbucket, see Bitbucket Integration.
Supported file types
Panoptica's uses KICS, GitLeaks, and Semgrep to scan your IaC files, secrets, and code vulnerabilities (CWE) respectively. You can learn more about these tools and view the types of files supported on their sites:
- KICS: https://docs.kics.io/1.7.10/platforms/
- GitLeaks: https://github.com/gitleaks/gitleaks
- Semgrep: https://semgrep.dev/products/semgrep-code/
Repositories View
In the default Repositories view, you'll see a table with all the code repositories you have onboarded to Panoptica.
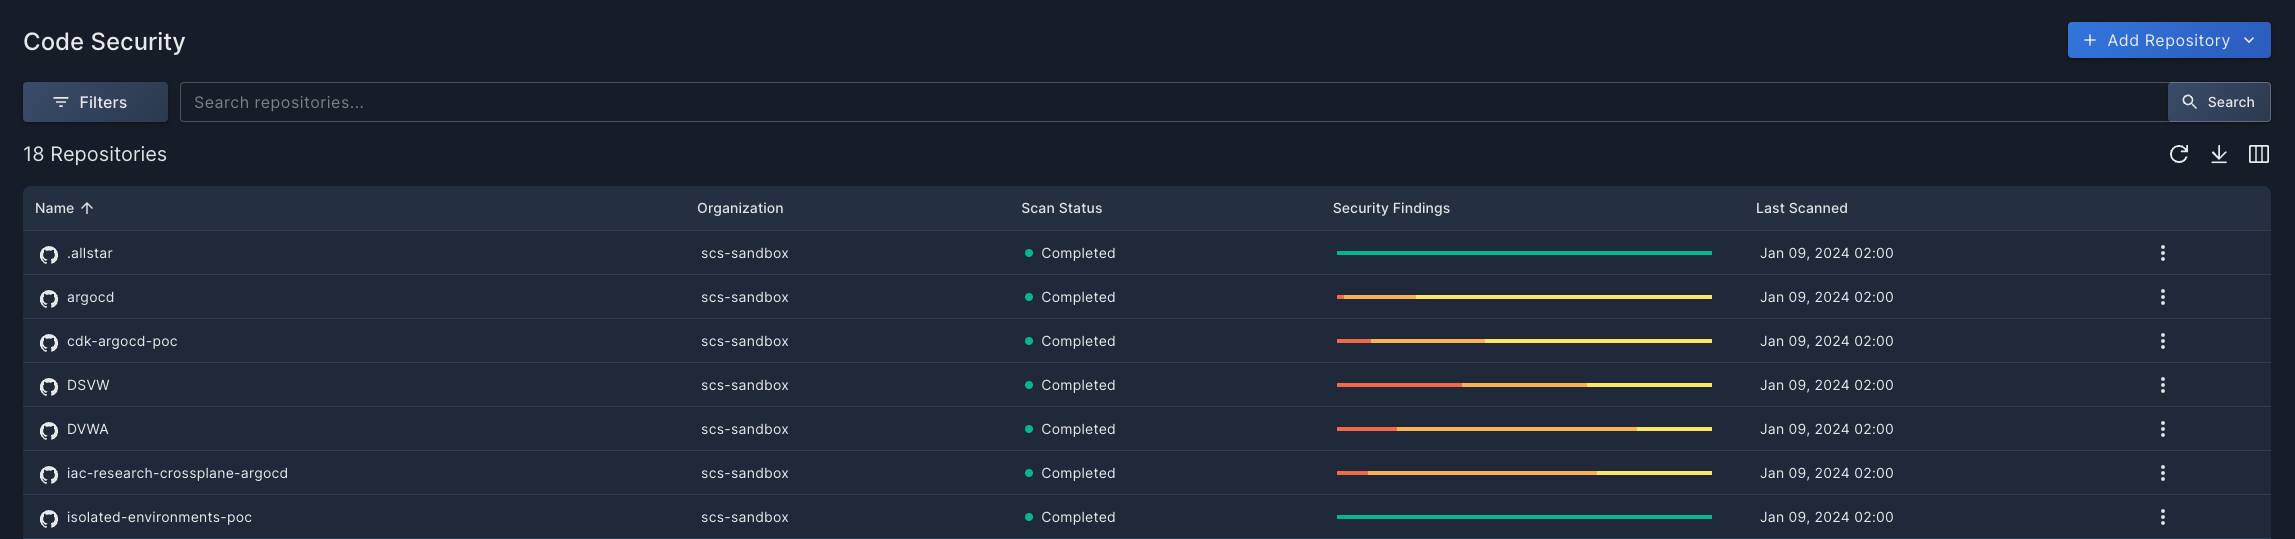
- Click the Filter button to narrow the list according to provider, scan status, organization and/or visibility.
- Use the Search bar to look for all or part of a repository or organization name.
- Click the circle-arrow icon at the top of the table (↻) to refresh the table, without the need to refresh the whole page.
- Click the Arrange Columns icon at the top of the table (▥) to select which columns to display, and in which order.
- If you have a large number of repositories, you can configure how many are displayed on each page. This option appears at the bottom of the table.
The table displays high-level information about each repository, including the name, the organization, the scan status, and the last time it was scanned. A bar graph indicates the severity of the findings broken down by four levels: Critical, High, Medium, and Low. Hover over the bar graph to see the number of findings according to their severity level in a pop-up overlay. The icon beside the repository name indicates the provider where that repository is located.
Click the three dots (⁝) at the end of each record to open a drop-down list of actions you can perform on that repository:
- Select Go to Repository to view the code repository itself in a new browser tab.
- Select Rescan to initiate a realtime scan of the selected repository.
Security Findings View
Click any row in the Repositories list to view details about the security findings discovered in that repository.
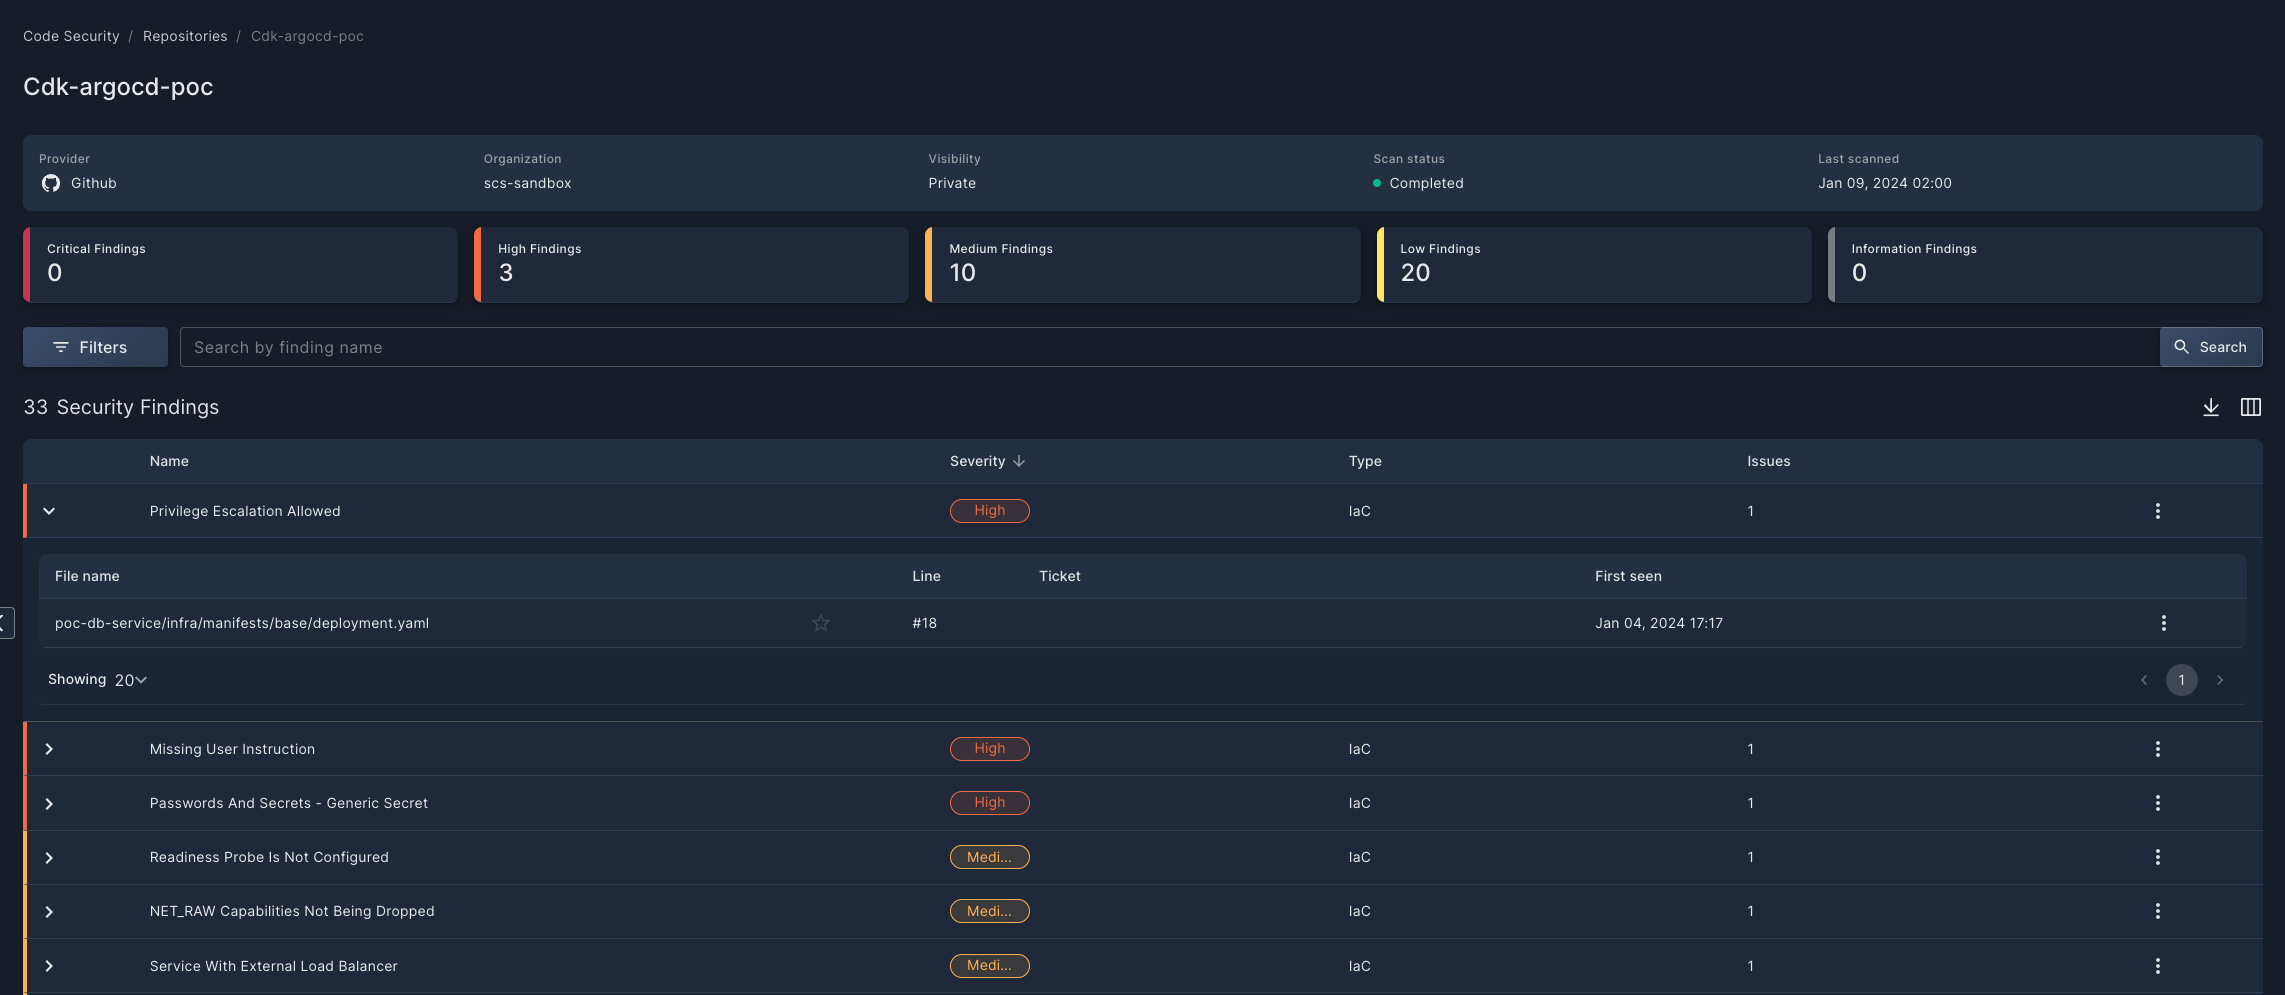
At the top you will find summary information about the repository you are viewing, as well as a widget bar that provides a holistic view of the security findings identified, broken down by severity level. You can also click on these cards, which serve as "quick filters" for the security findings below.
Click the Filter button to narrow the list according to severity, type, and/or issue status. Use the Search bar to help you focus on specific findings that you want to analyze.
The Security Findings table provides a snapshot view of issues identified in the code repository. Expand any row in the table using the chevron (>) at the beginning of the line to view all of the instances in which that finding appears, including the file name and even the line number that triggered the finding.
Click the three dots (⁝) at the end of each line to open a drop-down list of actions you can perform on that finding:
- Select Create Ticket to open a ticket in whichever Task Management you have configured in Panoptica: Atlassian Jira or ServiceNow.
- Select Dismiss to ignore a finding that you don't want scanned for the time being. You might do this if you encounter a false positive, for risk tolerance, or if you're just not sure about the issue's impact.
Security Findings Details
Clicking on a file name in the Security Findings table pops up a side window that displays additional details about that finding.
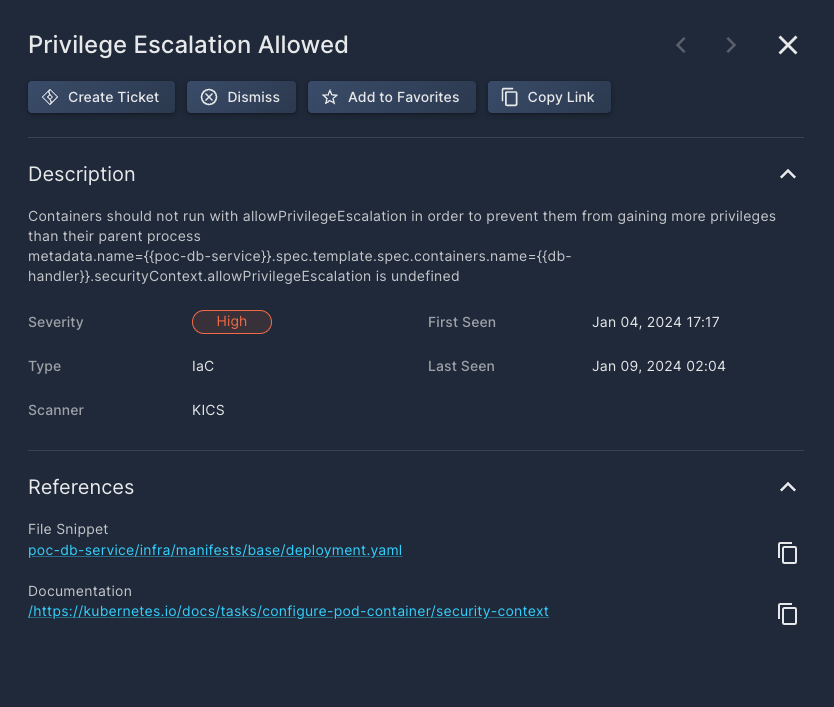
The buttons at the top of the overlay window enable specific actions on that finding:
- Click Create Ticket to open a ticket in whichever Task Management you have configured in Panoptica: Atlassian Jira or ServiceNow.
- Click Dismiss to acknowledge the finding, and hide it from future scans.
- Click Copy Link to retrieve a URL of a page displaying these details. .
Under Description, you will find additional details about the finding, enabling you do dig deeper into the issue and gain a better understanding of how it can impact your security posture. The details under Description include which scanner discovered the issue, the type of code, when it was first discovered, and when it was last seen.
Under References you will find a link to the File Snippet where the issue was discovered, you will be able to click on it and get redirected to the exact line where the issue was triggered. Another link opens third-party Documentation, where you can learn more about the issues related to this security finding.
Panoptica scans your integrated repositories once a day, if there have been new commits. Repositories that have not received any new commits will not be scanned. You can always trigger a manual scan by clicking the three dots (⁝) at the end of each record and selecting Rescan.
Updated 10 months ago