Attack Path Analysis
An attack path is the flow of interconnected assets, accounts, identities, and/or permissions that an attacker can use to exploit a cloud environment. Akin to a road map, an attack path presents possible lateral movements in the cloud, which could be inside an account, cross-account, cross-provider, or even cross-platform.
The attack paths identified in the Panoptica platform provide full context, so you can visualize the impact of a potential attack on your business and prioritize as needed. Our attack path analysis considers the criticality of connected assets and whether they are public-facing or have over-permissive policies that could increase the severity of their exploitation. Using GenAI Dynamic Remediation, Panoptica provides contextual descriptions and actionable remediation steps. By better understanding the root cause of your risks, and their connections to one another, you can remove the guesswork and effectively resolve multiple security threats in one action.
View Attack Paths
Go to the Attack Path Analysis tab under Threats & Vulnerabilities to view potential attack paths that Panoptica has identified in your environment.
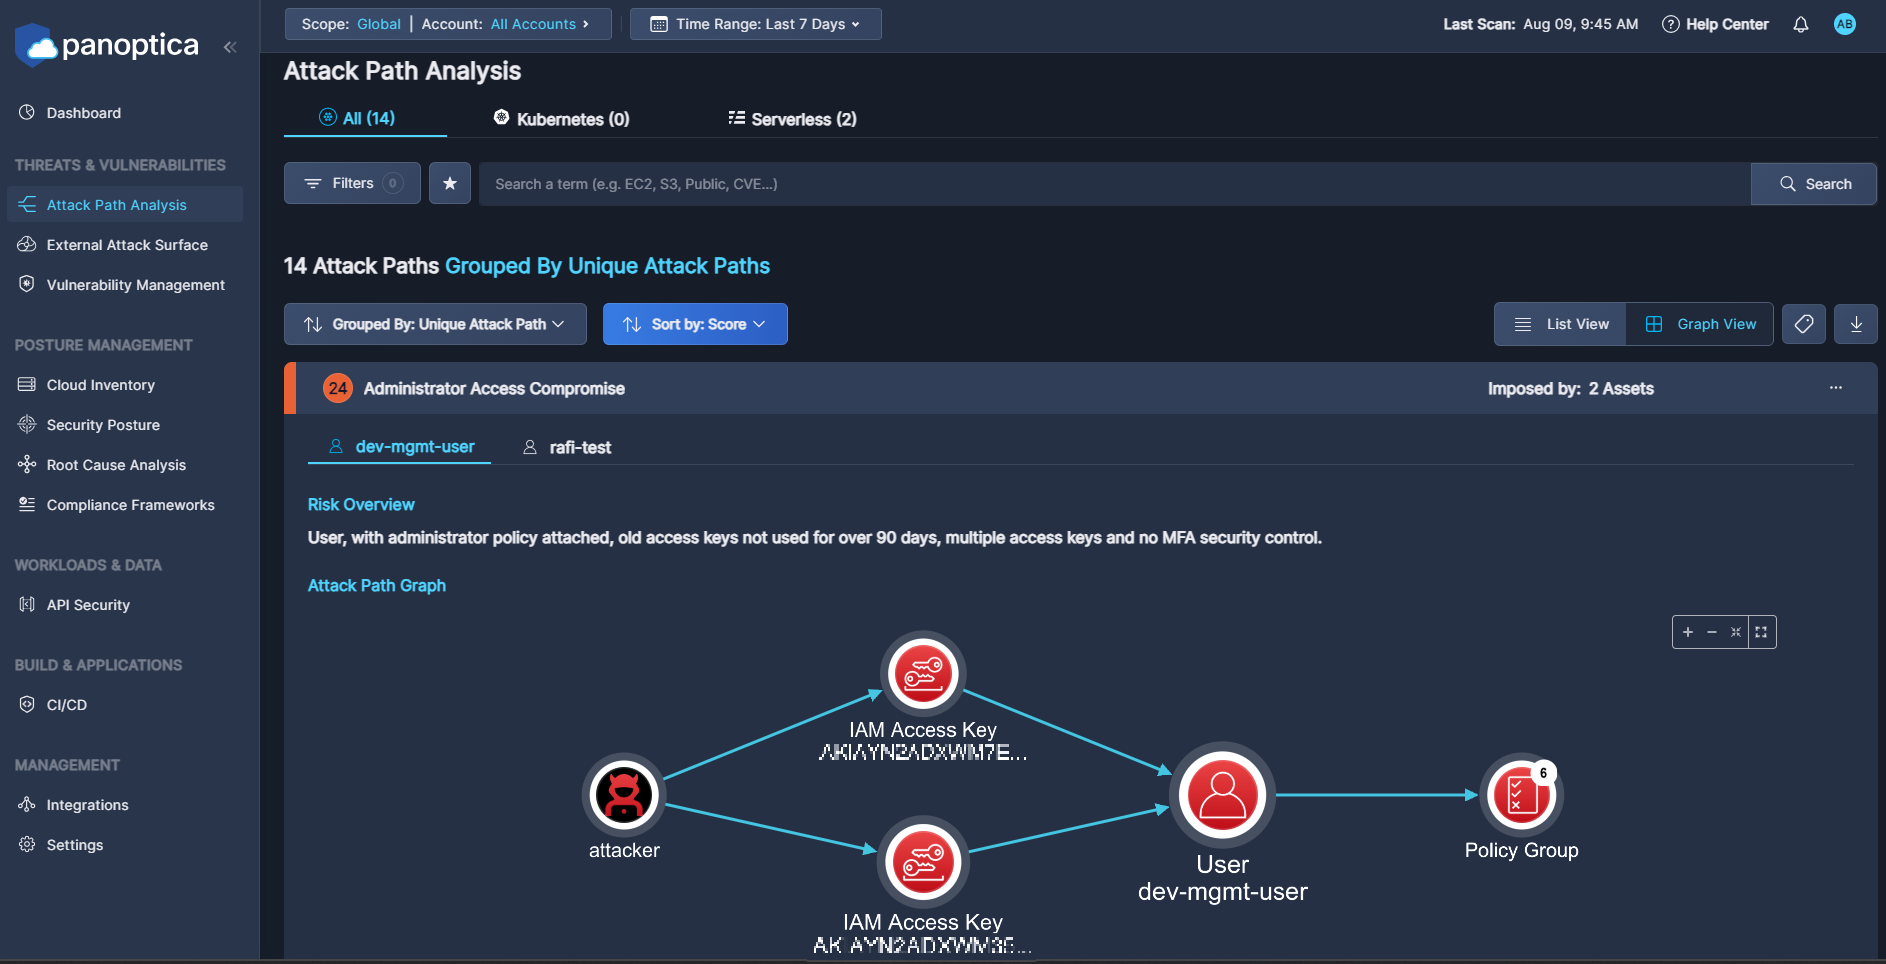
Use the Top Bar Filter to filter the findings by Scope, and Account using the drop-down lists at the top. You can also select the time frame during which the security finding was last seen.

You can further filter the results by one of the fields in the Filters drop-down box: Status, Severity, Provider, Labels, Service Category, Service Name, and/or Region.
Type into the Search bar to filter by text in the Attack Path Name or Risk Overview. You can select multiple filters at a time.
Exclude Trusted Address BlockIf you want to exclude trusted IP addresses from Panoptica's Attack Path Analysis – such as those associated with GCP's Identity-Aware Proxy (IAP) – please contact your Cisco Customer Success team about setting up an allowed list.
Attack Path Table
The table on the Attack Path Analysis tab displays potential attack paths that Panoptica has identified in your environment. The number of attack paths that have been identified appears at the top of the table.
Click Grouped by to aggregate the results by Unique Attack Path or Attack Path Name.
Click Sort by to sort the list of attack paths by Score, Attack Path Name, Severity, or Attack Path Category.

Graph View
The default Graph View displays a visual representation of the path that an attacker could take to exploit a weakness in the system. The graph-based approach facilitates investigation over a timeline, with detailed information about each action’s impact on the risk of the attack path. This approach exposes the real risk of these security findings, as each attack path reflects the probable chain of attack that a malicious actor would likely leverage in the specific environment.
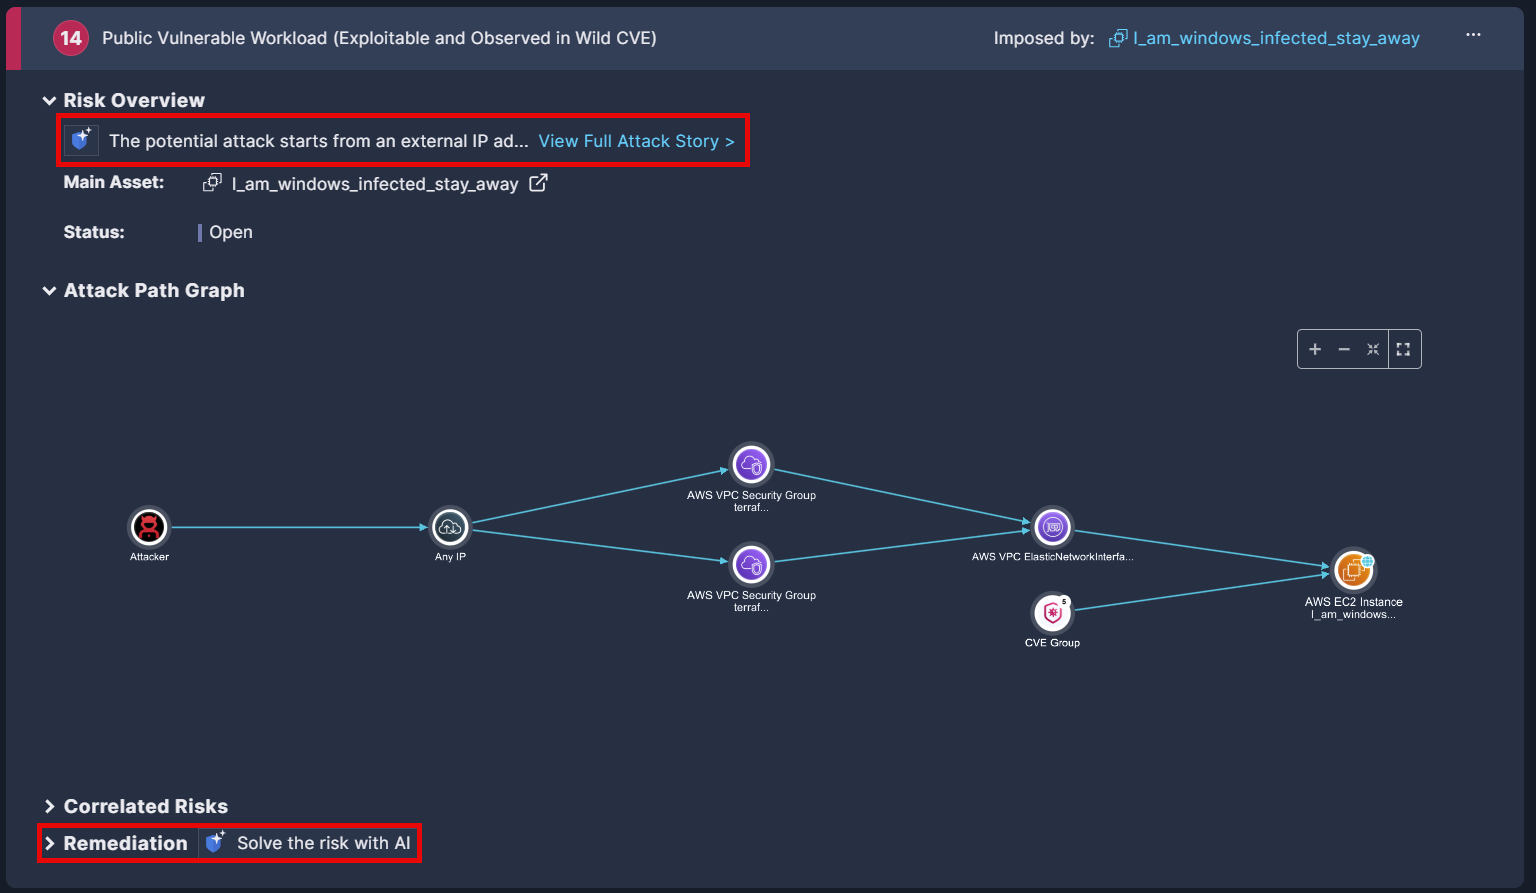
Imposed by is the asset on which the attack path was found.
Risk Overview provides an AI-generated summary that tells the attack “story”. Click View Full Attack Story to expose relevant details regarding the resources and risks that could make up a potential attack
Attack Path Graph is the crux of Panoptica's attack path analysis. Hover over each icon in the path for additional information about that resource, such as asset details, network exposure, workloads at risk, identity risks, and attack scenario.
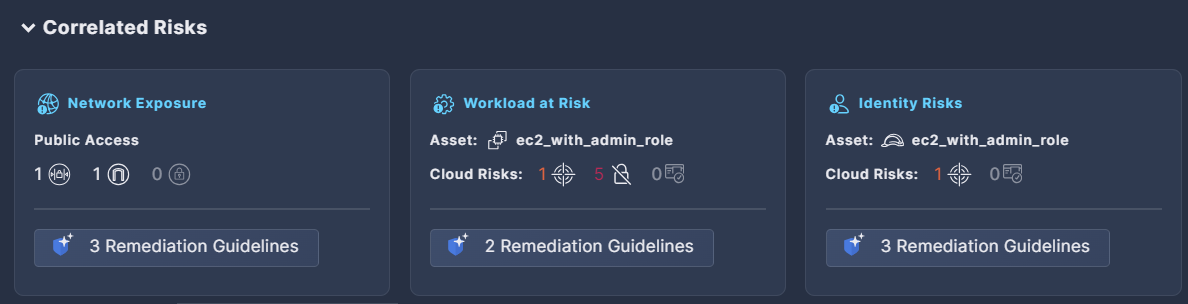
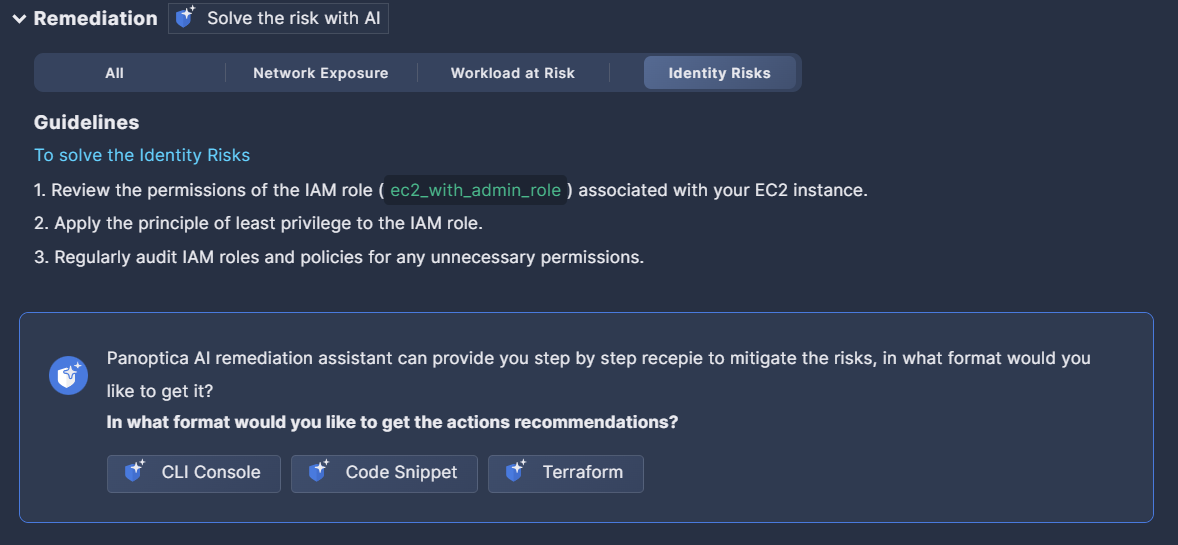
Correlated Risks displays risks that are related to the same root cause.Remediating the root cause will remediate all the correlated risks at the same time. Click Remediation Guidelines to view AI-generated steps for each risk type
Remediation displays AI-generated guidelines for remediating the risk, such as altering a specific configuration, limiting internet access to an asset, creating new security keys, and more. Click Solve the risk with AI to view ready-made solutions in the form of CLI commands, code snippets, or Terraform code, which can be included in the Jira or ServiceNow ticket you’ll open.
Click the Copy link below to copy the mitigation steps to the clipboard.

Click one of the Thumb links to provide feedback on the recommendations provided. The Panoptica team is continuously working to improve the accuracy of the auto-generated guidelines and solutions; we encourage your input on this.
List View
Switch to List View via the button at the top of the table to view a list of attack paths in textual form. The columns in the List view are: Score, Attack Path Name, Severity, Attack Path Category, Related Assets, and Labels.
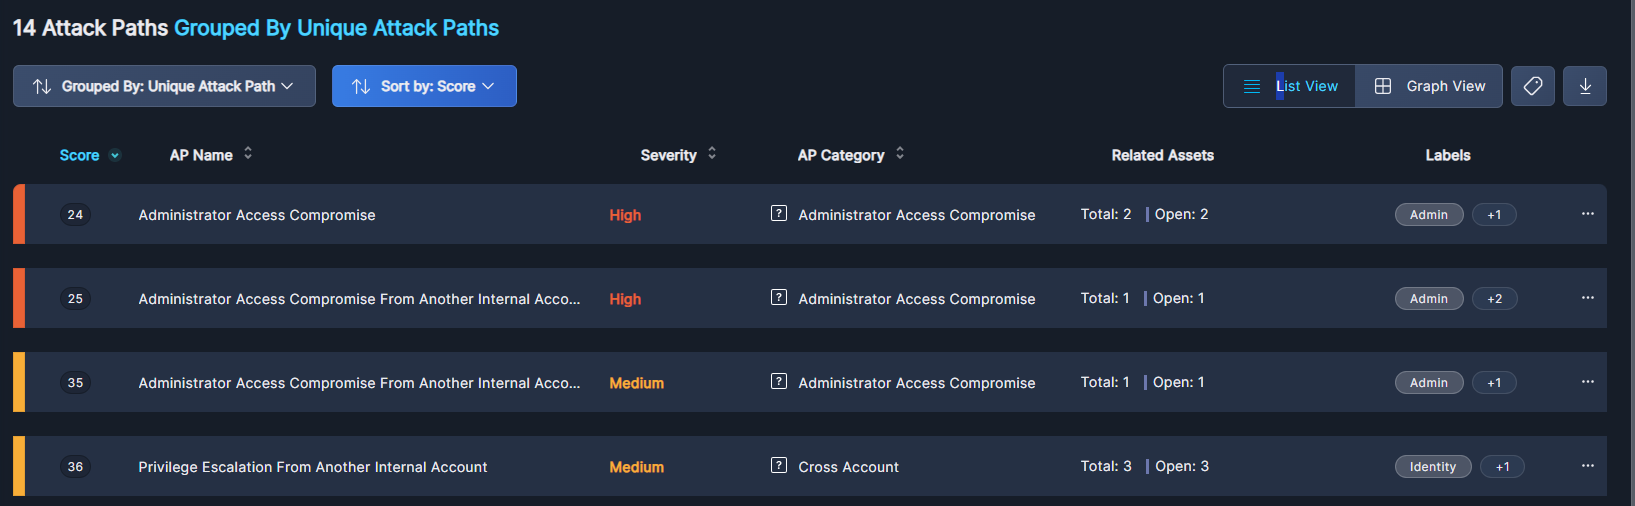
Score shows the risk criticality, on a scale from 0 (Critical) to 100 (Safe). The severity of an attack path is based on that of the assets in that path. For more, see Asset Health Score.
Severity is a color-coded rating of the risk severity, taking into account the ease of an attacker to achieve network access, sensitivity of the end target node, workload configuration issues, permission wildcards, cross account risks, neglected assets in the path, exposed credentials, and more.
Attack Path Categories gives a wider frame for filtering and prioritizing between attack paths. Paths concerning the same general risk will have the same category, and a single path can be labeled with multiple categories if it includes several causes of risk.
Related Assets lists other resources—such as servers, databases, storage buckets, and more—where the same risk has been identified. By exploring this information, you can better understand the spread of security issues across your infrastructure, enabling more targeted remediation efforts.
Actions
Click the three dots (•••) to open a drop-down list of actions you can perform on an attack path.

- Select Share Link to generate a URL to this specific attack path, in Graph View.
- Select Assign to refer this issue to any user within Panoptica. This is distinct from creating a ticket in an integrated Task Management tool, like Jira or ServiceNow.
- Select Create a Ticket to open a ticket in whichever Task Management tool you have configured in Panoptica: Atlassian Jira or ServiceNow. Once created, you can track the status of the ticket directly from Panoptica.
- Select Add to Favorites to bookmark this attack path.
- Click Dismiss to acknowledge the risk, and hide alerts related to this attack path.
At the bottom of the Attack Path window, you can define how many items to display on each page, from 5 to 200.
ExampleTo see an example of an attack path analysis, see Use Case for Attack Path Analysis
More informationFor more information on attack paths, see Attack Path Analysis: What It Is and Why You Should Care
Updated 10 months ago