Asset Inventory
Today's IT landscape is comprised of a diverse range of assets distributed across multiple cloud accounts, code repositories, APIs, SaaS applications, and Kubernetes clusters. These assets include data, code, configurations, and other resources critical to the functioning of the organization. However, the lack of centralized visibility into these disparate assets often presents challenges in asset management, risk management, resource allocation, access control, compliance and data governance.
Panoptica's Inventory feature provides centralized asset visibility in a single, consolidated platform. This is where you will find details about the assets impacted by the security insights Panoptica provides, such as Vulnerability Management, Security Posture, and Attack Path Analysis. The Inventory tab provides a holistic view of an organization's digital resources, across different providers and platforms. You can filter assets by a number of set parameters; customize your search using our advanced query language; and group assets for simpler review. Assign metadata like sensitivity, criticality, and labels to improve asset management and risk assessment.
Inventory tab
Go to the Inventory tab under Posture Management in the Panoptica console UI to start learning about all the assets Panoptica has discovered across your environment.
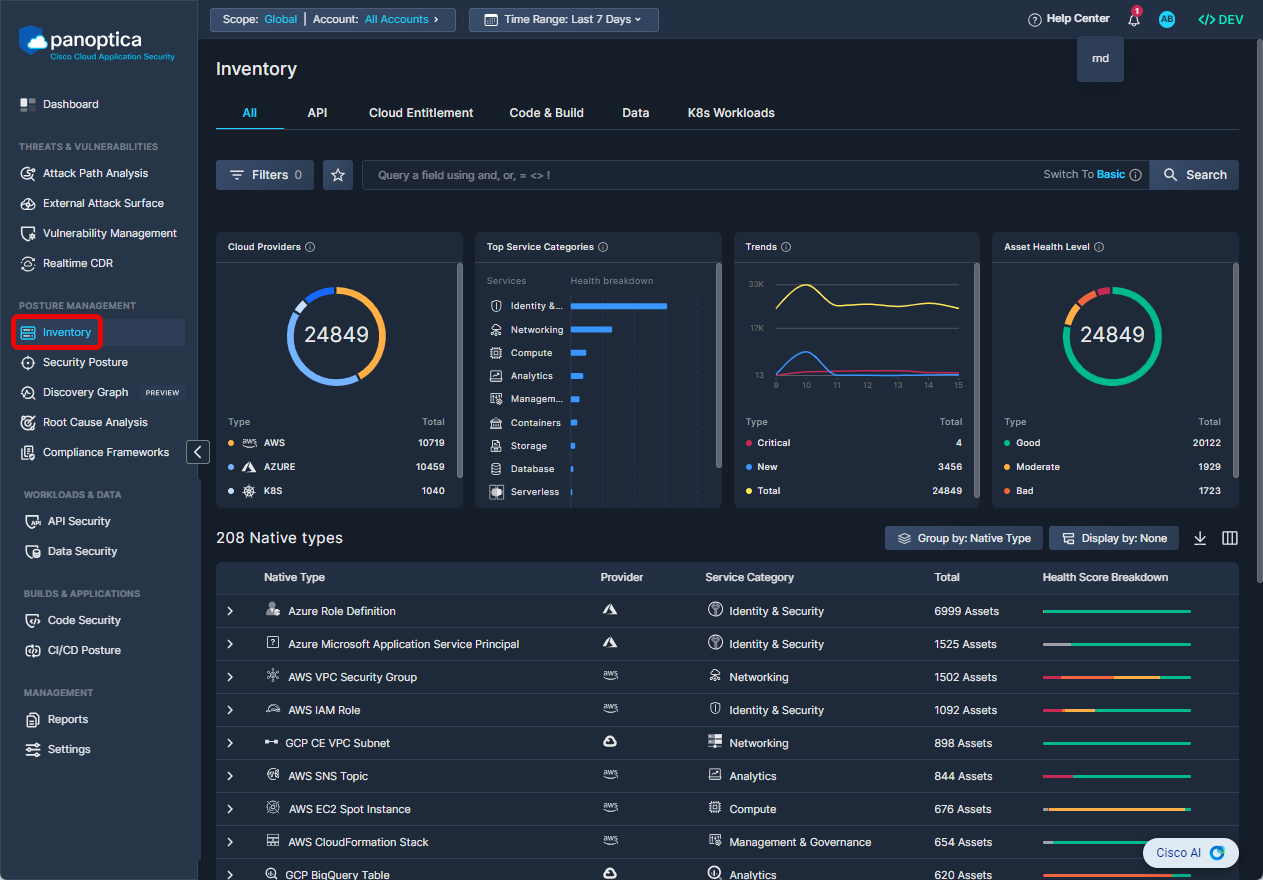
Use the Top Bar Filter to refine results across the platform by Scope and Account. You can also select the time frame you wish to focus on, from "Last 24 Hours" to "Last Month".

The default view of the Inventory tab provides visibility into All of your assets in a single view.
Click the Data subtab to view a dashboard-to-detail view of the Data Inventory Panoptica has discovered in your environment.
Filter and Search
You can further refine the view beyond the Top Bar Filter by using using predefined filters and custom queries:

-
Use the drop-down Filters option to narrow the results by: Provider, Account Name, Service Category, Native Type, Health Level, Labels, Region, Data Type, Security Insights, Sensitive, Favorite, Ignored, Realtime.
-
View any assets you have marked as a Favorite by clicking on the star icon ✩, next to the Filters button.
-
Compose simple Queries to search for specific assets. Click the circled question mark the view query language options and examples:
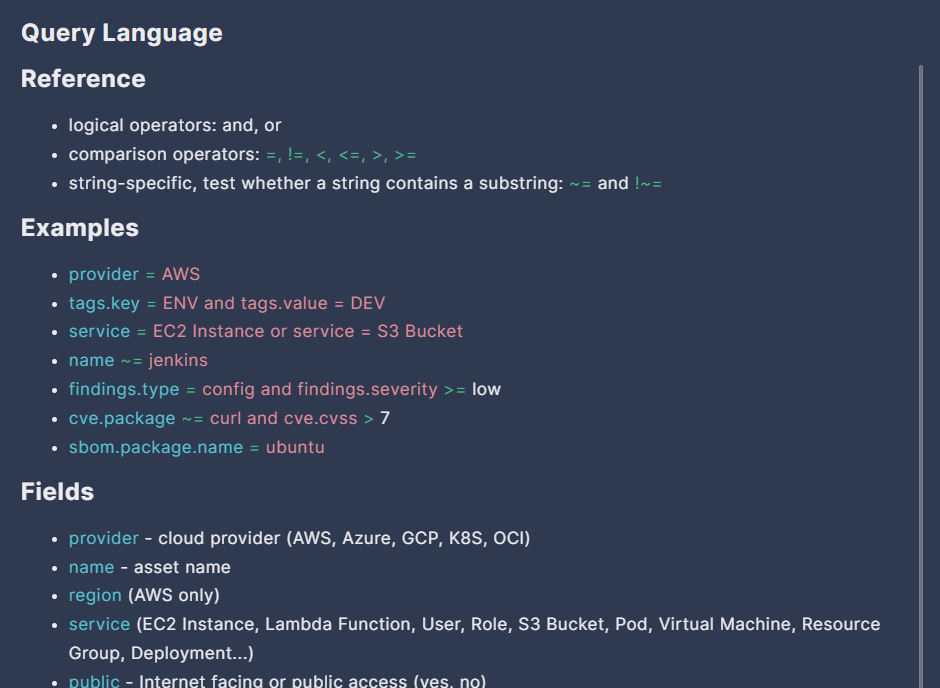
- Reference - Logical, Comparative, and string-related operators.
- Examples - A list of examples that you can click on to automatically add to your search.
- Fields - All the fields that can be used in the query language search.
Inventory Dashboard
The four widgets that make up the Inventory dashboard provide snapshot insights into your asset inventory, gleaned from the resource you have integrated with Panoptica.
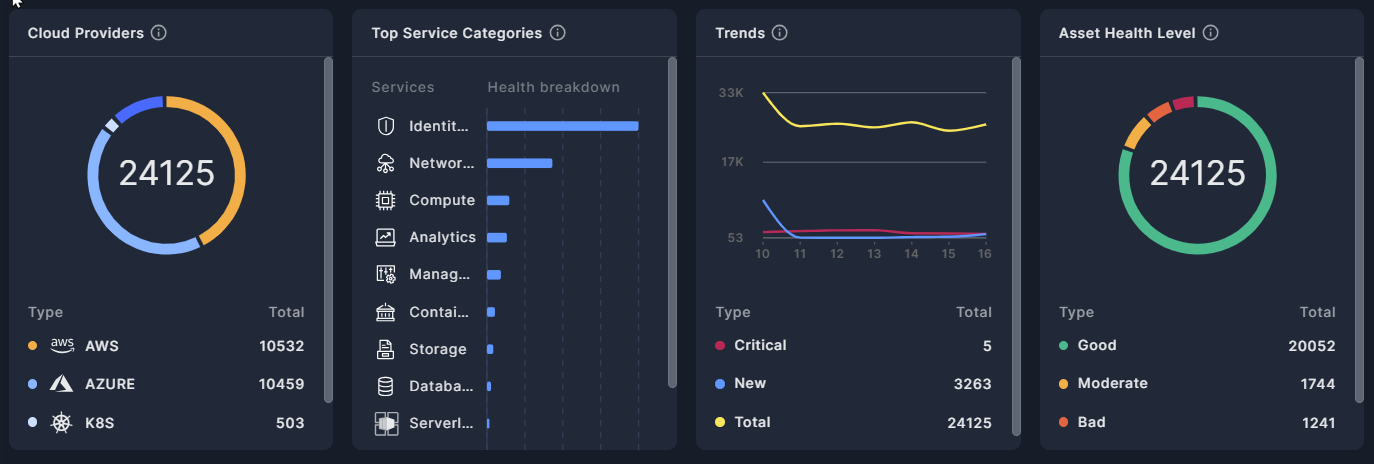
- The Cloud Providers widget displays the total number of assets in your environment, by provider. Click on a provider name in the list to set an instant filter.
- The Top Service Categories widget depicts the most common category of assets per service. Click on a category name in the list to set an instant filter.
- The Trends widget presents new, critical, and total assets in two ways: a daily trend, and cumulation over time.
- The graph displays a daily count of new, critical, and total assets discovered over a 24 hour period. Hover over any point on the graph to view the number of assets discovered on any given day.
- The chart below the graph summarizes the total number of assets discovered over the entire period displayed. Click on a property in the table to filter all data by that field.
- Health Score Breakdown breaks down the number of assets into four health score levels: Critical, Bad, Moderate, Good. Click on a risk level in the list to set an instant filter. See Asset Health Score for more information on asset health.
Asset Table
Below the widgets, Panoptica lists all the assets discovered throughout your environment. The assets are displayed according to the filters you set, and grouped by Native Types – the cloud vendors' original naming conventions (i.e. AWS S3 Bucket). For that reason, there may appear to be duplicate listings, such as SQLite from AWS and SQLite from GCP.
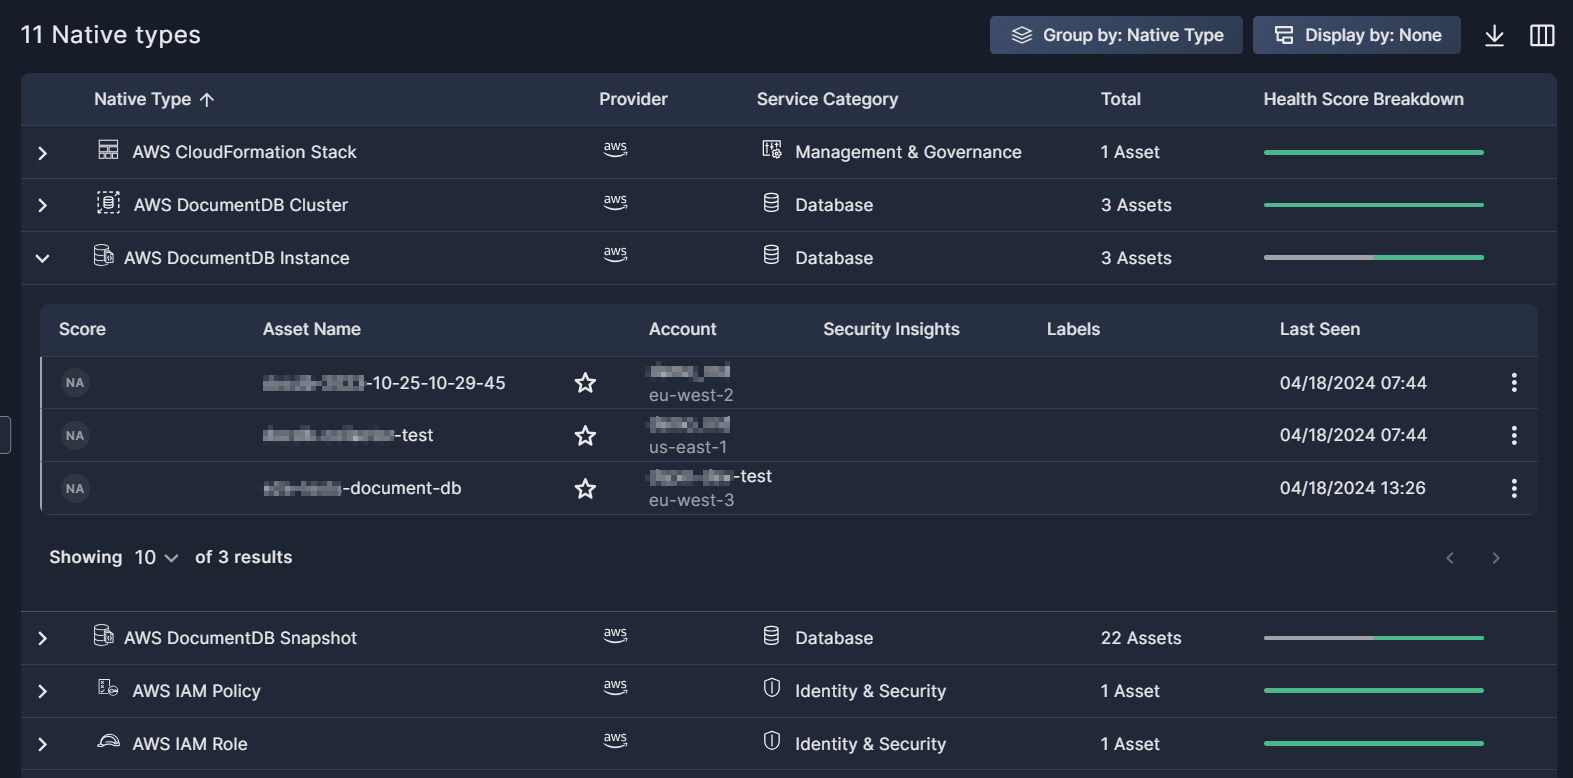
- The Assets table can be sorted by most of its columns: Native Type, Provider, Service Category, and Total.
- Click the Display by button to further aggregate the list according to: Account, Service Category, or Health Level.
- Click the down arrow (↓) in the upper right corner of the table to Download the list of assets in JSON or CSV format.
- Select which columns are displayed by clicking the Columns button (▥).
Expand any line to view a detailed lists of assets in that Native Type, which can be further sorted by Health Score, Asset Name, Account, Security Insights, and when it was Last Seen.
Click the three dots (⁝) at the end of any record in the expanded asset view to open a drop-down list of actions you can perform on that asset:
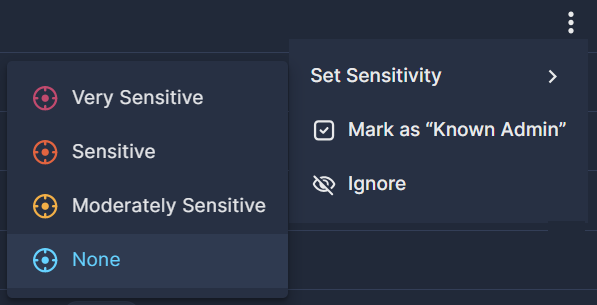
- Click Set Sensitivity to select the sensitivity level, in order to prioritize any higher severity alerts on it. See sensitivity levels for details.
- Mark an asset as a Known Admin to ignore high privilege alerts on it. You can add a comment when confirming this status, for future reference.
- Select Ignore to dismiss any alerts found on it. You can add a comment when confirming this status too, for future reference.
At the bottom of the screen you can configure how many records are displayed on each page, from 20 to 200 lines.
Asset Details Drawer
Click on any row in the detailed list view to pop up additional information about that asset in a side drawer.
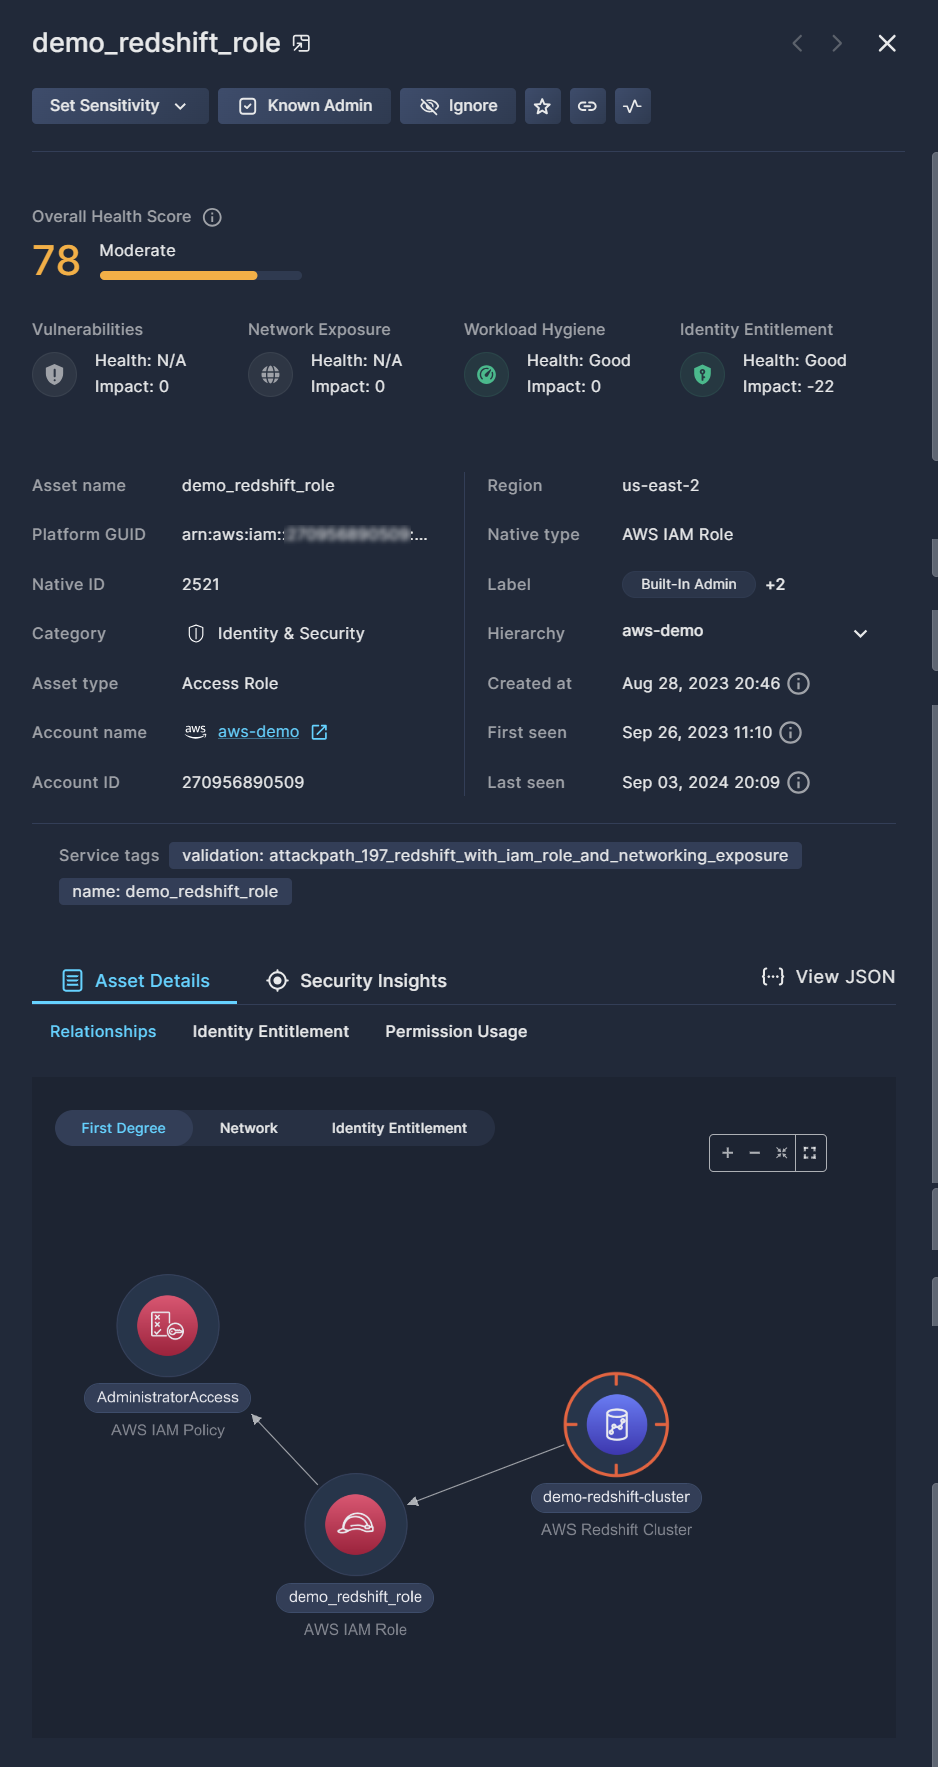
The buttons at the top of the pop-up window enable specific actions on that asset:
- Click Set Sensitivity to select the sensitivity level, in order to prioritize any higher severity alerts on it. See sensitivity levels for details.
- Mark an asset as a Known Admin to ignore high privilege alerts on it. You can add a comment when confirming this status, for future reference.
- Select Ignore to dismiss any alerts found on it. You can add a comment when confirming this status too, for future reference.
- Click the Add to Favorites to, well, add to favorites.
- Click Copy link to retrieve a URL of the full asset page. This is useful for record keeping or sharing this information with others.
- Click Activity log to view any action that have been taken on this asset in Panoptica.
Overall Health Score
The Overall Health Score helps you visualize the health of your asset, presented on a scale from 0 to 100, where lower scores indicate potential security issues. The score is comprised of four aspects that impact an asset's security: Vulnerabilities, Network Exposure, Workload Hygiene, and Identity Entitlement. See Asset Health Score for more information on asset health.
Asset Properties
Below the Health Score, the side drawer displays far more details than those shown in the Asset Table:
Asset name: the unique name of the selected asset.
Platform GUID: the global unique identifier for the selected asset in the cloud platform.
Native ID: the identifier used by the cloud platform.
Category: the Service Category of the selected asset.
Asset type: the category or class of resource in the cloud platform.
Account name: the provider account where the asset was discovered. When available, this appears as a link that opens a new tab to the service provider console, where you can view the asset in context.
Account ID: the identifier of the provider account.
Region: the global region where the asset is located.
Native type: the cloud vendor's original naming convention.
Label: any labels that have been added, either manually or via Data Type Classification.
Hierarchy: the organized structure of resources and accounts where the asset was discovered.
Created at: when the asset was created in the cloud platform.
First seen: the first time Panoptica observed the asset in your environment.
Last seen: when Panoptica most recently observed the asset in your environment.
Asset Details
The Asset Details tab enables you to drill down even further into the asset's properties. Click View JSON to download the Asset Details in a JSON file.
The subtabs that appear under Asset Details will vary according to the type of asset being examined.
- The Relationships subtab displays a graphical view of related assets, network architecture, and identity enablement
- The Host subtab provides details regarding the operating system and hardware architecture of the host environment.
- OS type: The type or family of the operating system installed on the asset, such as Windows, Linux, or a specific distribution of Linux.
- OS version: The specific version of the operating system installed on the asset. This is essential for tracking software updates, patches, and ensuring compatibility with security requirements.
- OS End-of-Life: The date when the operating system vendor or developer discontinues support for the specified OS version, including security updates and patches.
- Restart Required: During workload scanning, Panoptica analyzes the configuration to determine if the host requires a restart.
- The SBOM subtab lists the libraries that make up the software bill of materials, if relevant.
- The Data subtab provides details regarding data assets, such as datastore, version, encryption, replication, etc. The Data subtab will appear for Analytics and Database assets.
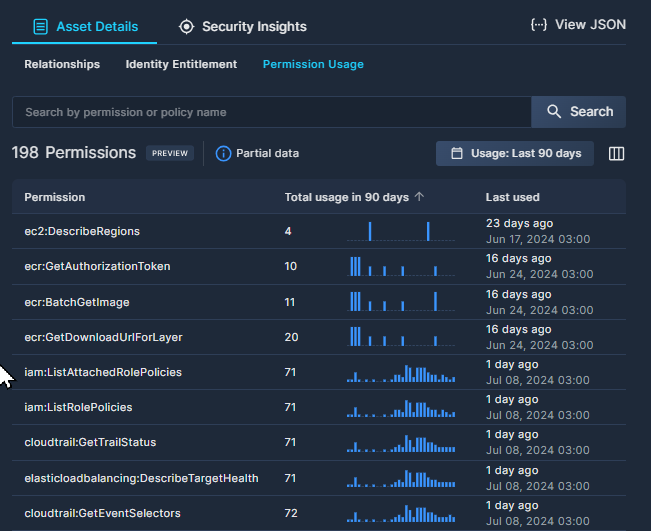
- The Permission Usage subtab displays all of the permissions used by this asset in the past 90 days. This is only available in AWS Roles and AWS Users currently.
Permission Usage is in Preview mode, and may not be available in all tenants.- Use the Search bar to look for specific permissions or policy names
- If you see the Partial Data flag, that means Panoptica is still parsing three months of CloudTrail data. This will clear after a few more scans.
- Click the Usage dropdown box to narrow the time frame to 30, 14, or 7 days.
- Total Usage indicates the number of times each permission was used, as well as a graphical representation of how many times per day.
- See the last time the permission was used under Last used.
Security Insights
The Security Insights tab provides an asset-centric view of the Attack Paths, Vulnerabilities, and Posture Risks associated with this asset.
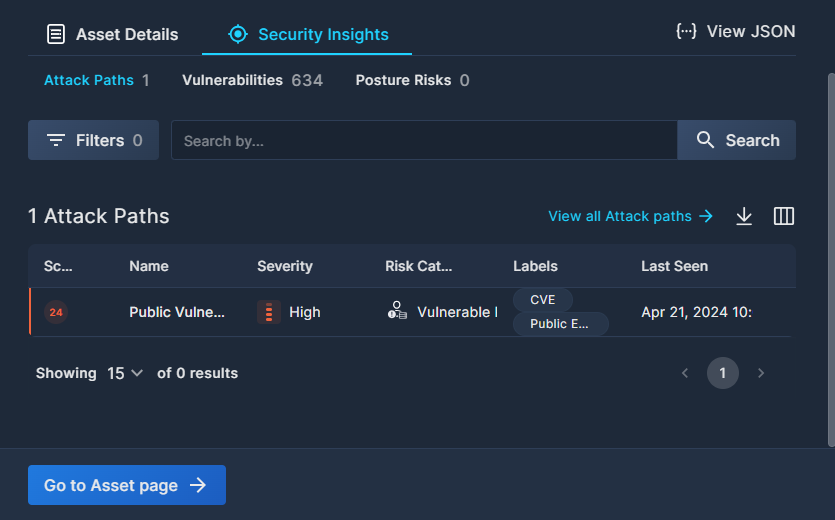
- An Attack Path is the flow of interconnected assets, accounts, identities, and/or permissions that an attacker can use to exploit a cloud environment. This subtab shows any attack paths containing this asset. Learn more about this tab at Attack Path Analysis.
- The Vulnerabilities subtab lists any Common Vulnerabilities and Exposures (CVEs) that have been identified in this asset. The information displayed here is a subset of the Vulnerability Management page, showing only the following columns:
- CVE ID: the unique CVE identifier, or any other alias ID when the CVE ID is not available, such as GHSA, ALEA, etc.
- Severity: Critical, High, Medium, Low, or Informational
- CVSS Score: the standardized Common Vulnerability Scoring System score, on a scale from 0 to 10.
- EPSS Score %: Cisco's "Exploit Prediction Scoring System" (EPSS) estimates the probability that a vulnerability will be exploited in the wild in the next 30 days, on a scale from 0 to 100%.
- Fix: whether there is a known fix available.
- Prioritized: whether the CVE is prioritized or not
- Assets: the number of compute assets in which the CVE appears.
- The Posture Risks subtab lists any security issues identifies with this asset. See Security Posture to learn more about this information.
Click Go to Asset page to view these same details in a full-page view, much like the Copy Link button above.
Updated 10 months ago