External Attack Surface
Bad actors can exploit public domains to gather information or find an entry point into your system. Vulnerabilities such as open ports, outdated software, or misconfigured servers can pose significant risks to the cloud environment. Panoptica's Attack Surface Discovery provides insight about your public facing attack surface, allowing your security team to identify vulnerabilities and potential entry points attackers can exploit.
By leveraging Shodan, and employing DNS forwarding and reverse lookups, Panoptica's non-intrusive scan provides intelligence on open ports, CVEs related to discovered services, Content Security Policy (CSP), and more.
Go to the External Attack Surface tab under Threats and Vulnerabilities to view all the information Panoptica has collected regarding the potential attack surface of your environment.
Attack Surface tab
You can add a new domain to scan and review by clicking on the +Add Domain button in the upper right corner.
Filter and Search
Use the Top Bar Filter to narrow down the findings across the platform by Scope, and Account using the drop-down lists at the top. You can also select the time frame during which the security finding was last seen.

Top Bar Filter
You can further refine the results using predefined filters and open search.
- Use the drop-down Filter option to narrow the results by: Service, Provider, Labels, Domain, Insights, Region, and/or Visibility.
- Use the Search bar to look for all or part of an asset name or service name.
To clear the search, delete any text in the field and click Search on an empty field.
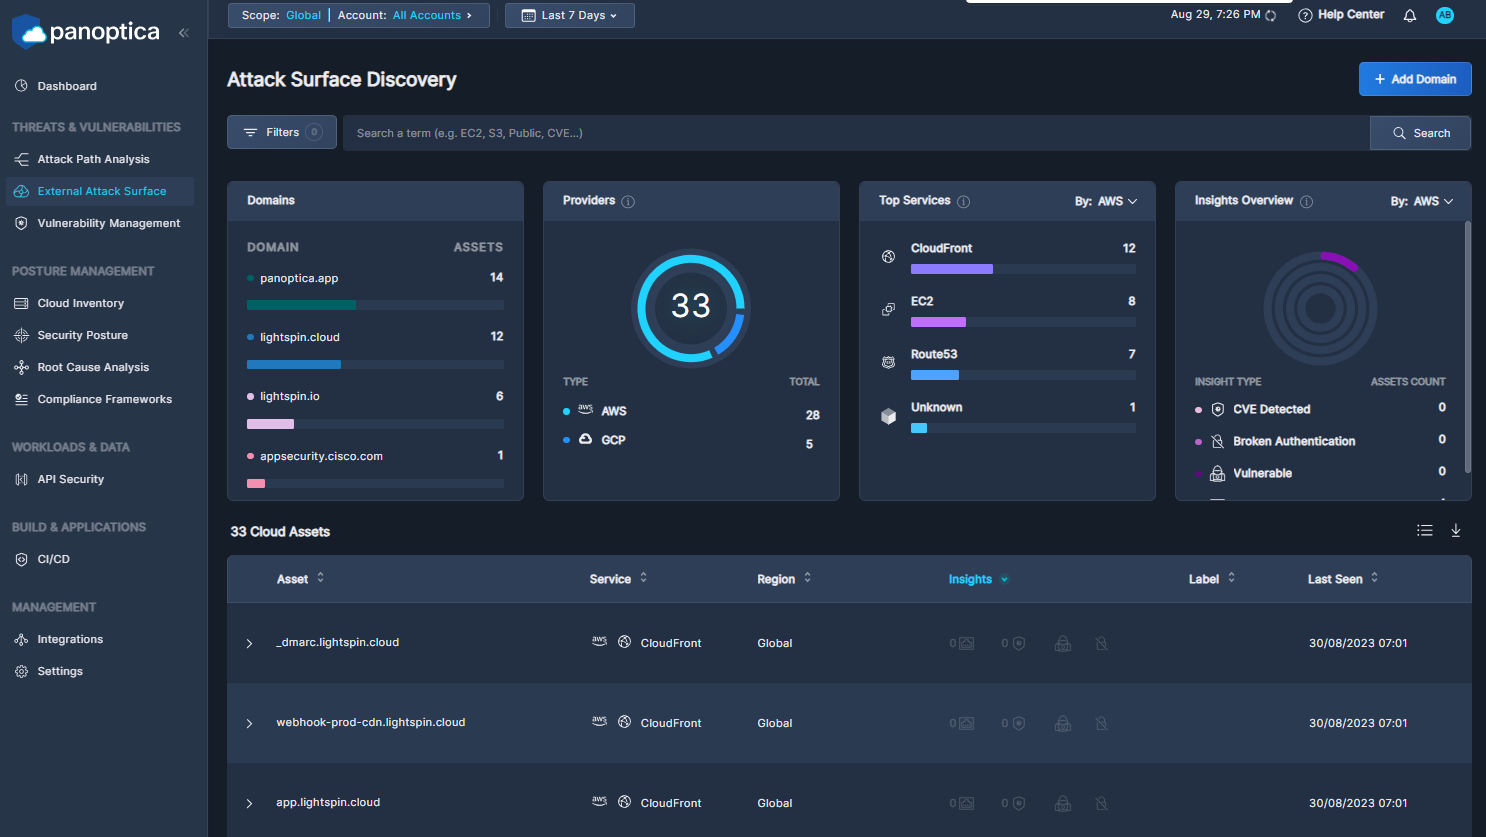
Attack Surface Dashboard
The Attack Surface Discovery dashboard is made up of four widgets that enable you to dive deeper into the information that can be gleaned through your domains. By understanding the potential vulnerability of your cloud domains, you can secure your business information and prevent an attack.
- The Domains widget lists all the domains that have been added and scanned. The number of identified assets is shown next to each domain. Clicking a domain name activates a filter, which enables you to drill down into that domain's attack surface in the Cloud Assets table below.
- The Providers widget indicates the number of assets in each cloud service provider you've connected to Panoptica. Click a section of the pie graph, or a provider name listed below, to filter the identified Cloud Assets by that provider.
- The Top Services widget reflects which services have the most assets, according to cloud service provider. Click on one of the services to filter the Cloud Assets by that service.
- The Insights Overview widget breaks down the potential security issues according to the vulnerability type, such as broken authentication, CVE detected, etc..

Attack Surface Dashboard widgets.
Cloud Assets
The Cloud Assets table below the Attack Surface dashboard lists all of the domains Panoptica has identified in your environment. In addition to the Asset Name, the table also displays the Service type, Region, any Insights that may be inferred, Labels, and when the domain was last observed.
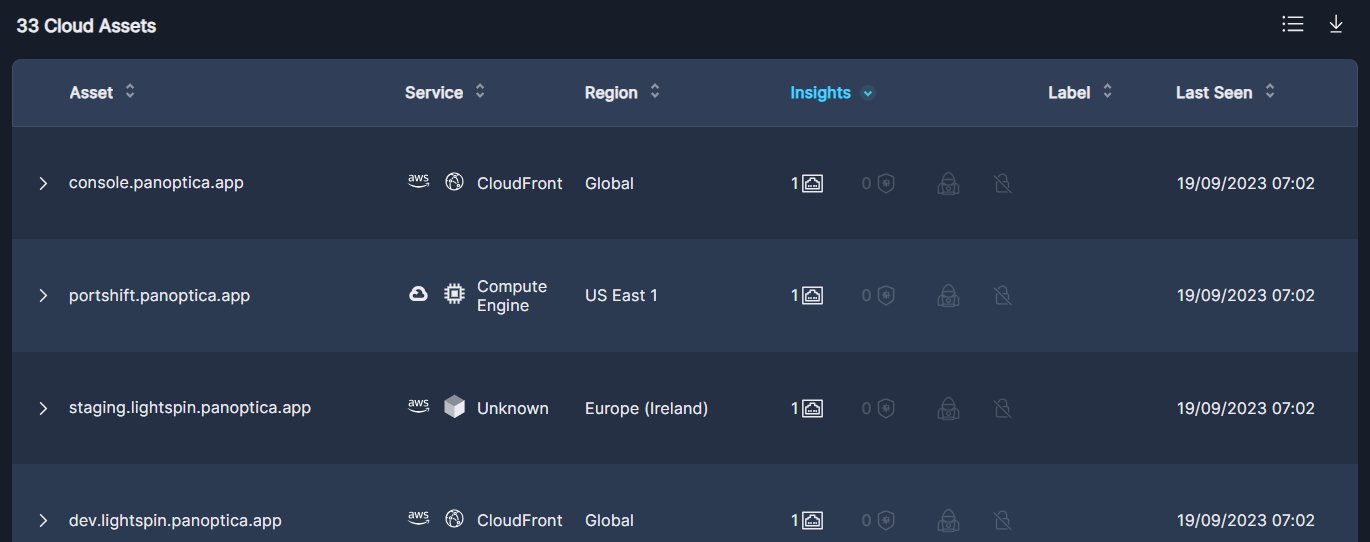
Cloud Asset Table
Expand any row in the table using the chevron (>) at the beginning of the line to view full details about that domain, including CNAME, IP addresses, and the attack path leading to the cloud asset. Your security team can use this information to understand the attack surface and how to secure the asset.
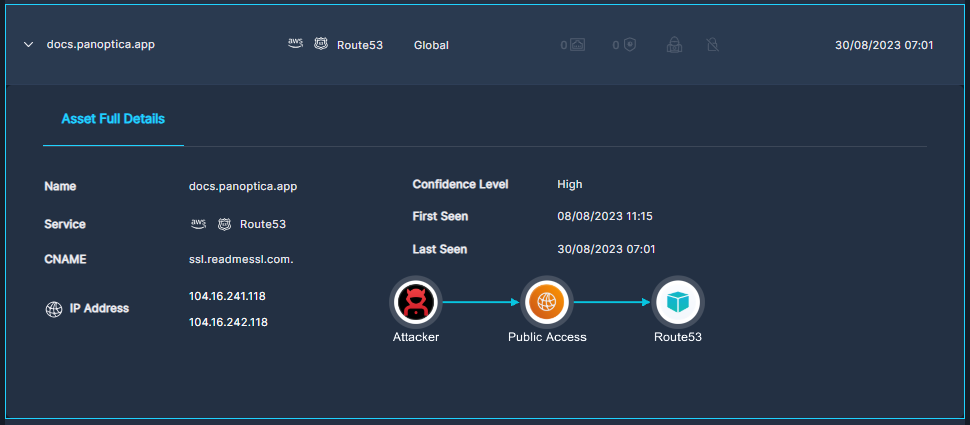
Cloud Asset details
Updated 10 months ago