Security Posture
Panoptica scans your cloud environments – whether AWS, Azure, GCP, OCI, Kubernetes, or a combination –for security issues and vulnerabilities. Beyond simply listing the results, Panoptica allows you to filter, group, and visualize these findings to gain a better understanding of your security posture. By viewing related assets, discovering remediation steps, and creating tickets in your task management platform, you can effectively act to reduce risks in your cloud environment.
Security Posture Dashboard
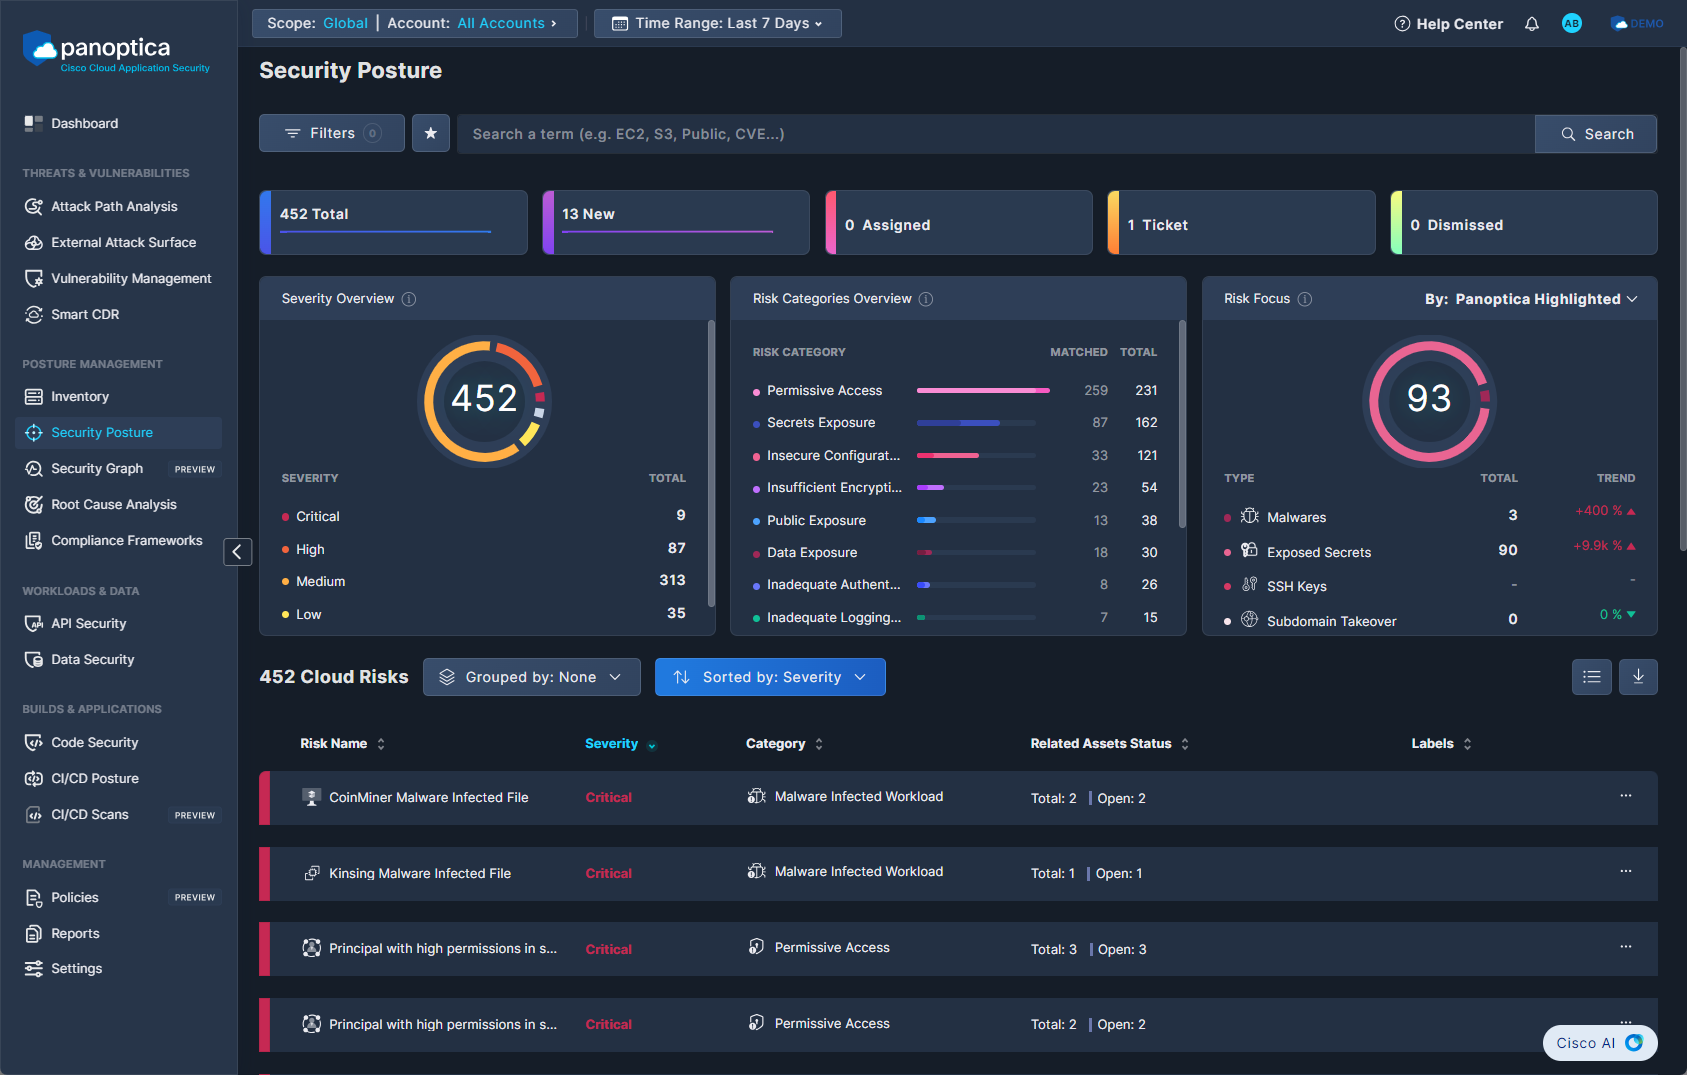
Go to Security Posture under Posture Management in the main navigation pane to view, explore, and understand the security findings that Panoptica discovered in your environment.

Use the Top Bar Filter to filter the findings by Scope, and Account using the drop-down lists at the top. You can also select the time frame during which the security finding was last seen.

You can further filter the results by one of the fields in the Filters drop-down box:
- Account
- Provider
- Risk Categories
- Risk Focus
- Risk Name
- Service Name
- Ticket Status
- Status
- Severity
You can select multiple filters at a time.
You can also filter for text that appears in the Risk Name or Risk Overview using the Search bar.
Widgets
Three widgets on the Security Posture tab provide a clear, high-level view of the most pertinent information.

The Severity Overview widget provides a breakdown of the number of risks detected at each severity level: Critical, High, Medium, Low, Information. Click on any segment of the graph—or the corresponding line in the table—to filter the list of risks accordingly.
The Risk Categories Overview widget provides a breakdown of the number of risks detected in each Risk Categories. This provides insight into which areas are most impacted by security issues, and helps prioritize remediation efforts accordingly. Click on any category to filter the list of risks accordingly.
The Risk Focus widget provides a breakdown of the critical risks that require immediate attention, as well as trends of these risks. This helps you understand the evolution of critical risks, and identify patterns or recurring issues. Click on any focus area to filter the list of risks accordingly.
Cloud Risks Table
The table on the Security Posture tab displays all of the security findings that Panoptica has identified in your environment.
Visit Supported Services and Risks to view the complete catalog of risks Panoptica can identify, sorted by provider, service name, and category.
Visit Policy Rules to view the Posture Risk rules Panoptica applies to identify misconfigurations in your cloud environment. The posture risk rules are managed by Panoptica's research team. While every match will trigger a Security Posture risk finding, the severity of the findings is based on other considerations, such as any toxic combinations that could comprise an Attack Path.
The default view shows the Risk Name, Severity, Category, Related Assets Status, and Labels for each security finding. You can customize this view in several ways:

- Aggregate the results by any column, by using the Grouped by drop-down box.
- Sort the results by any column, by using the Sorted by drop-down box.
- Select Card View to see the results in grid format, or List View to see rows.
- Select which columns are displayed by clicking the Columns button, in the upper right.
- You can define how many items are displayed on a page, from 16 to 200 lines.
The list of findings can be downloaded in CSV format, for further review and analysis using Excel or any similar tool.
Risk Details
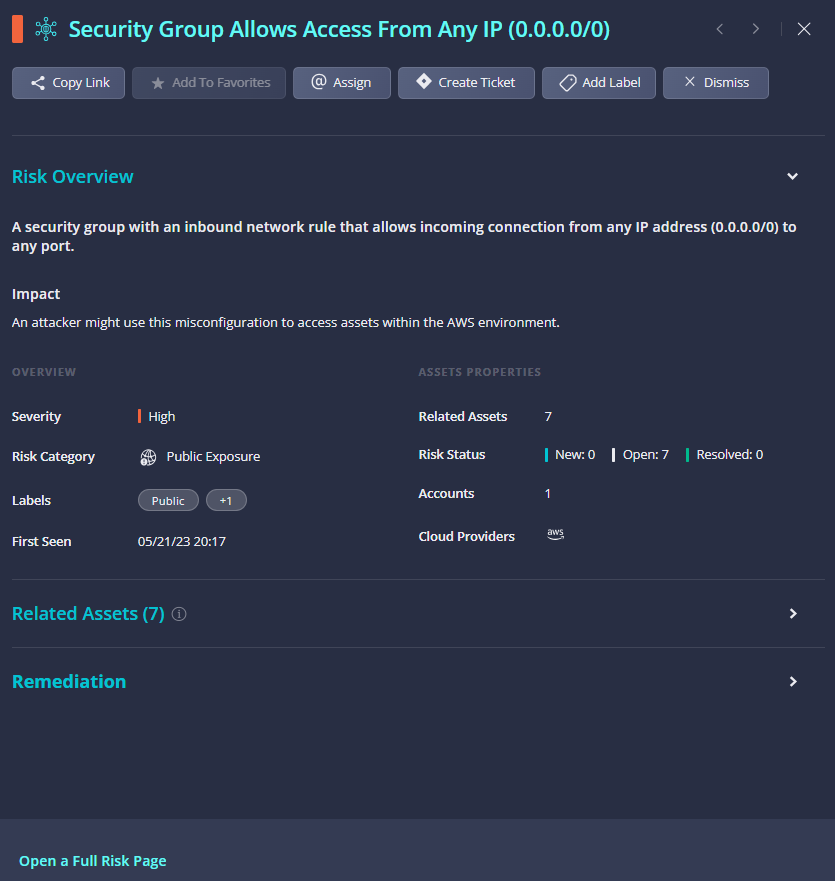
Click on any row/card to pop up additional information about that finding in a side window, including related assets and remediation steps, if relevant.

The buttons at the top of the pop-up window enable specific actions on that asset:
- Click Copy Link to retrieve a URL of the full asset page
- Click Create Ticket to open a ticket in whichever Task Management you have configured in Panoptica: Atlassian Jira or ServiceNow. Once created, you can track the status of the ticket directly from Panoptica.
- Click Dismiss to acknowledge and hide an alert related to this finding.
Click Open a Full Risk Page to view the Risk Details page in full screen.
Related Assets
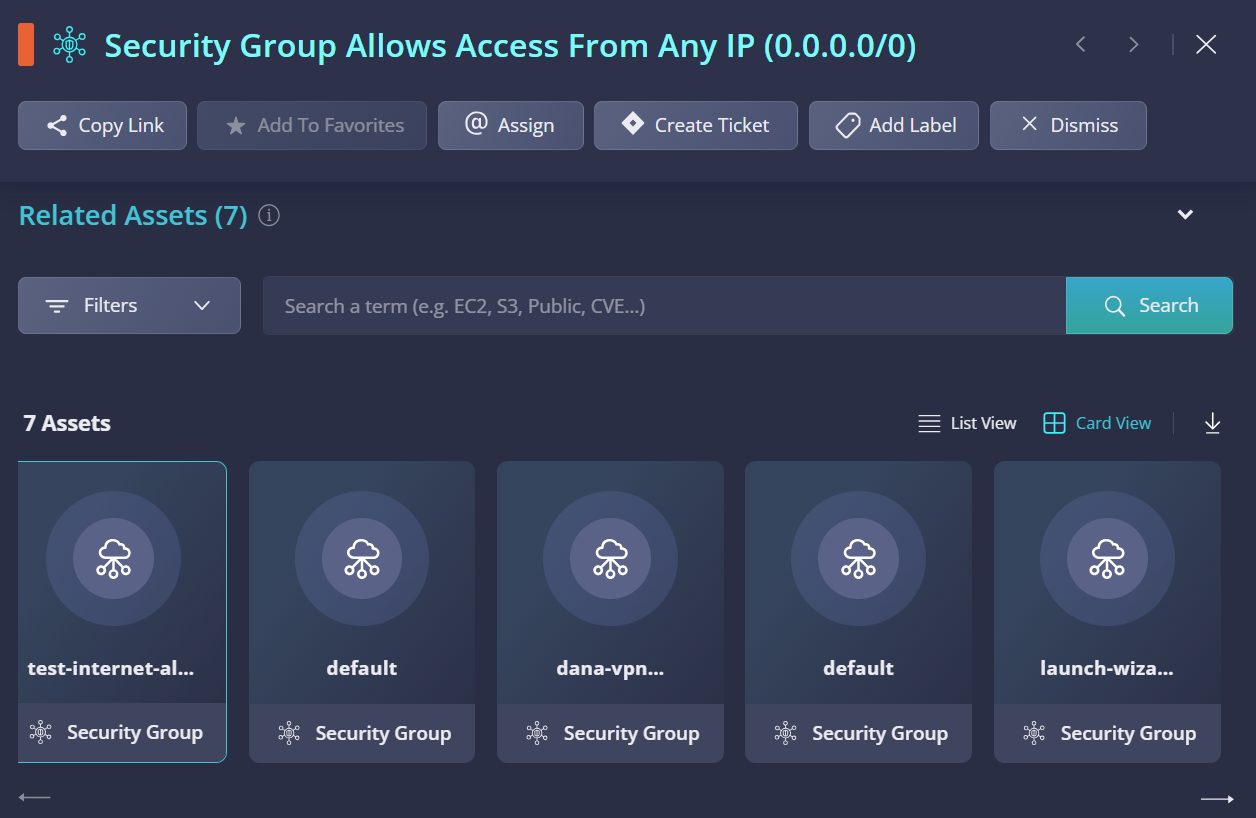
Expand the Related Assets tab to display other assets with the same risk.

The Related Assets view provides a list of other resources—such as servers, databases, storage buckets, and more—where the same risk has been identified. By exploring this information, you can better understand the spread of security issues across your infrastructure, enabling more targeted remediation efforts.
The list of related assets can be filtered by one of the fields in the Filters drop-down box. You can also filter for text that appears in the Risk Name or Risk Overview using the Search bar. Select Card View to see the results in grid format, or List View to see rows.
Remediation
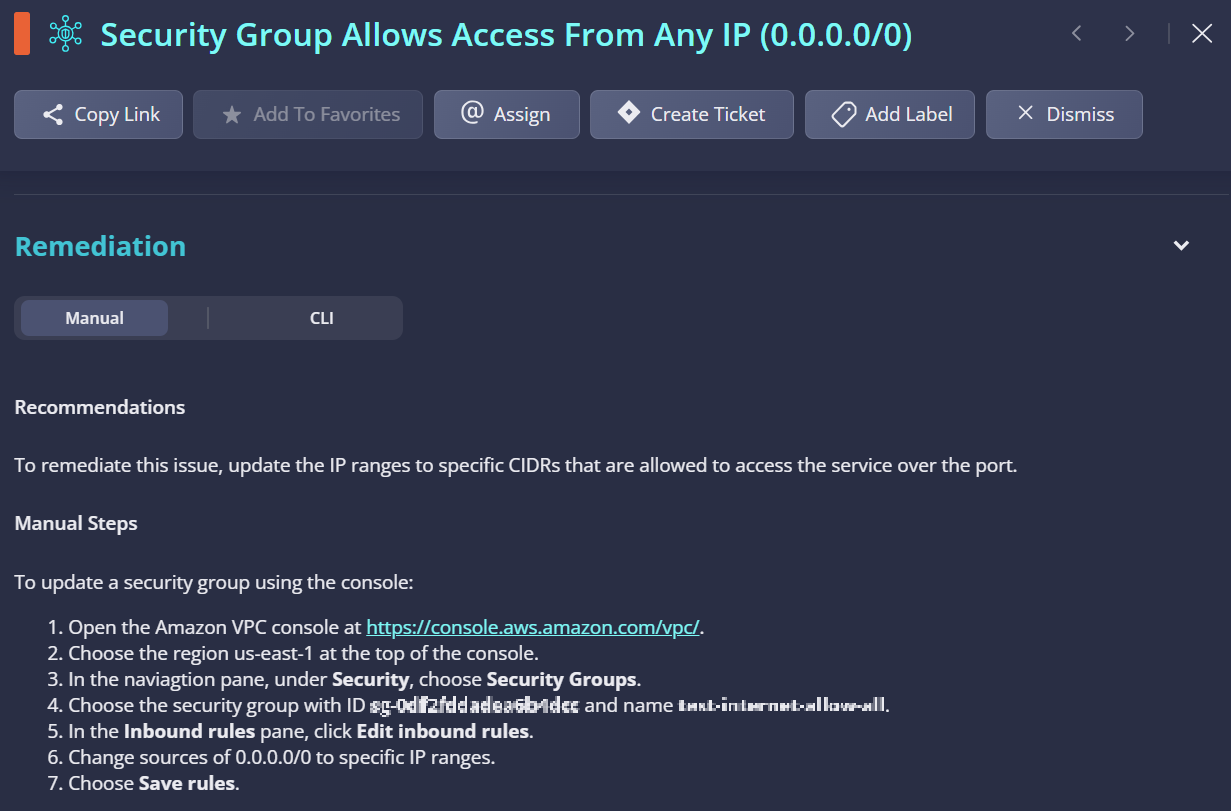
Expand the Remediation tab to display recommended solutions for remediating the security finding you are viewing. Choose Manual for step-by-step instructions, or CLI for command-line interface code.

Updated 7 months ago