Top Bar Filter
Across the Panoptica console, you will find drop-down menus in the top bar that enable you to filter the data set being addressed. The filters are global, and are remembered as you move around the platform.
Click Scope – Account to open a drop-down box where you can select the Scope and/or the Accounts you wish to focus on.
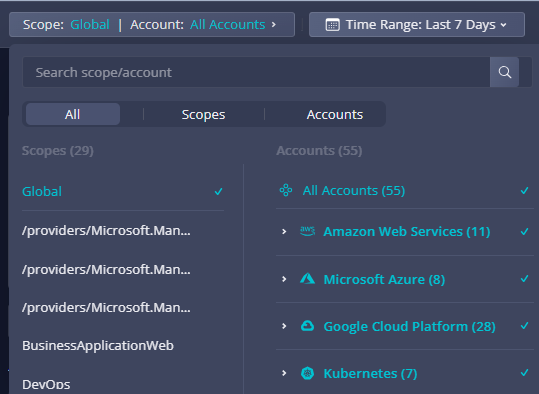
A Scope is a group of accounts and/or users. Visit Scope Management for details on how to define scopes. Scopes are also defined automatically by Panoptica based on organizational structure.
Under Accounts you will find all of the accounts you have onboarded to Panoptica, organized by platform. You can select as many as you want. Visit Accounts to learn more about accounts in Panoptica.
Use the Search bar at the top of the filter window to look for specific scopes or accounts by name.
Click Time Range to open a drop-down box where you can select the time frame during which the issue was last identified.
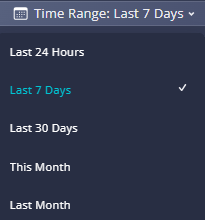
You can filter for issues that were last seen in the:
- Last 24 Hours
- Last 7 Days
- Last 30 Days
- This Month
- Last Month
Updated 10 months ago