Legacy Dashboard
The Dashboard is the heart of the Panoptica platform. It provides a graphical representation and summary of your deployed cloud accounts, using Widgets and a unique Attack Path Flow. We built the Dashboard to easily access the most critical information about your cloud environment.
The new Dashboard experience is more informative, more interactive, and more useful than the original. Click the New experience toggle in the top right corner of the screen to view the New Dashboard.
Select Dashboard in the main navigation pane to reach Panoptica's Dashboard.
Use the Top Bar Filter to filter the results by Scope, and Account using the drop-down lists at the top. You can also select the time frame over which the data was collected.

Dashboard Widgets
The top of the Dashboard view displays four widgets:
The Security Score widget displays the overall health score of your cloud environment, as well as that of each account. This score is aggregated from the health score of each individual asset in those accounts. See Asset Health Score for details.
Click an account name to create a quick-filter for that account

Fig 2. The Security Score widget
The Trends widget indicates how your environment has fared over time. You can view a percent change of New, Critical, and Resolved results—as well at the Total— according to Attach Paths or Findings. This feature helps to track workflow and assess cloud security progress.

Fig 3. The trends widget filtered by Attack Paths
The Compliance widget reports how your resources are scoring against the major compliance framework such as HIPAA, GDRP, and more.

Fig 4. Compliance widget filtered by AWS
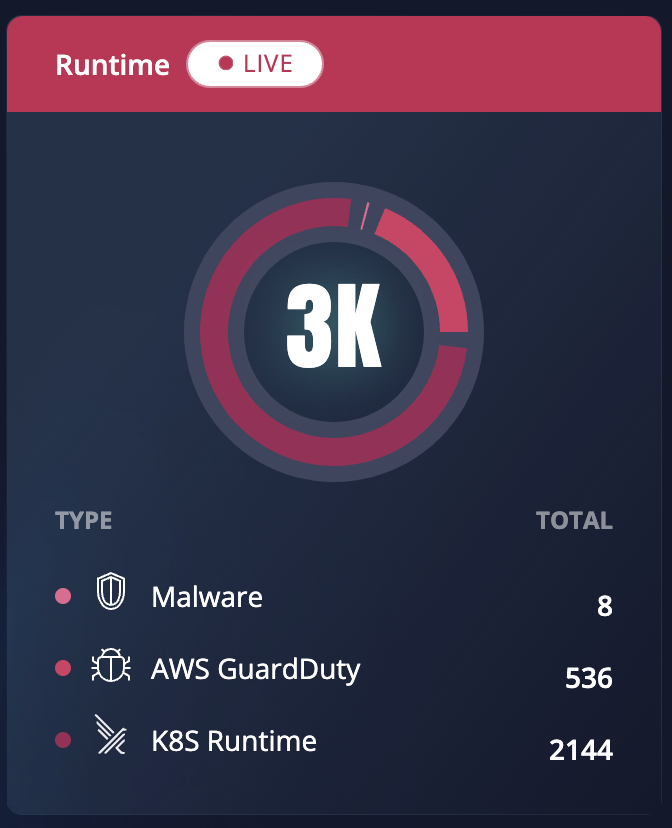
The live Runtime widget scans your cloud environment for any attacks happening in real time. If the asset is compromised, an alert will appear, allowing you to address the issue immediately.
Attack Path Flow
Panoptica's contextual prioritization is the unique differentiator of our technology. The Attack Path Flow makes cloud security even more intuitive. The Sankey diagram lets you easily visualize the flow from any risk engine or any severity level to the prioritized Attack Path. This visual highlights the flow with proportional currents to the number of Attack Paths detected as grouped by order of severity.
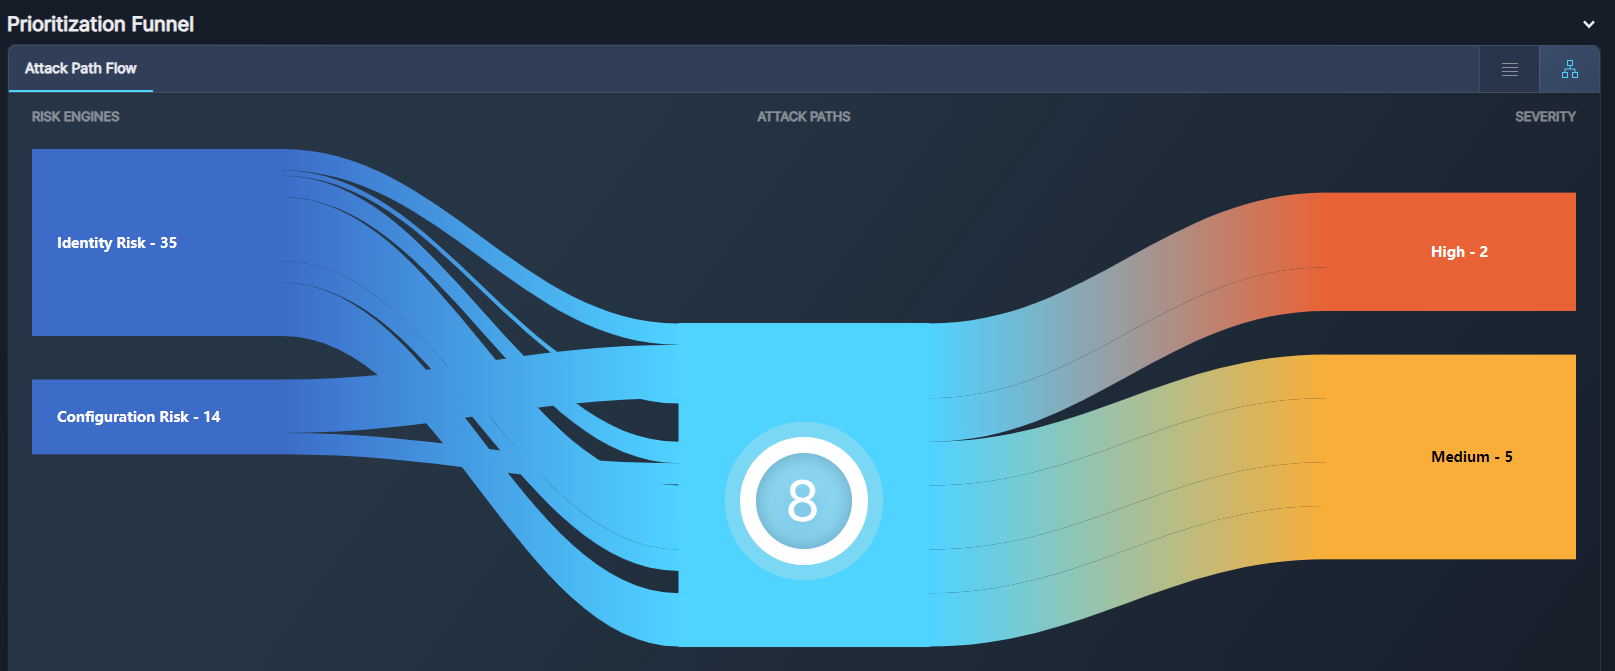
Fig 6. The Attack Path Flow in the Prioritization Funnel
Note that the Attack Path Flow displays the unique types of attack paths, i.e., attack paths with the same structure. For this reason, the number of attack paths in the Prioritization Funnel may be lower than the total listed in the Trends widget. That total includes all detected attack paths, including those of the same type.
Also note that the Attack Path Flow displays results from security findings only. There may be other issues contributing to Attack Paths, such as hidden findings. For that reason, the number of findings and attack paths in the Prioritization Funnel may differ slightly from those appearing on the Attack Path Analysis tab or the Security Posture tab.
Click a thread on the left side of the Sankey diagram to narrow the results according to Risk Engines. Click a thread on the right side of the flow to narrow the results according to Severity.
Switch to List View via the button at the top of the table to view the Attack Paths in a text form. The List View provides more details about each Attack Path: Severity, Risk Category, Risk Name, Impacted Assets, Labels, Status, and when it was last observed.
Click any row to open that Attack Path in a new browser tab. See Attack Path Analysis for more details on Attack Paths.
Updated 10 months ago