API Trace Sources
To finish connecting your APIs to Panoptica, you need to configure the Trace Sources. This is done by deploying a plugin to an API gateway, which communicates with Panoptica's API Security controller deployed on your cluster. The gateway plugin captures traces, providing visibility into API traffic across your workloads—as well as to/from external sources—enabling Panoptica to monitor run-time activity across your environment and better identify vulnerabilities.
Attach Trace Source
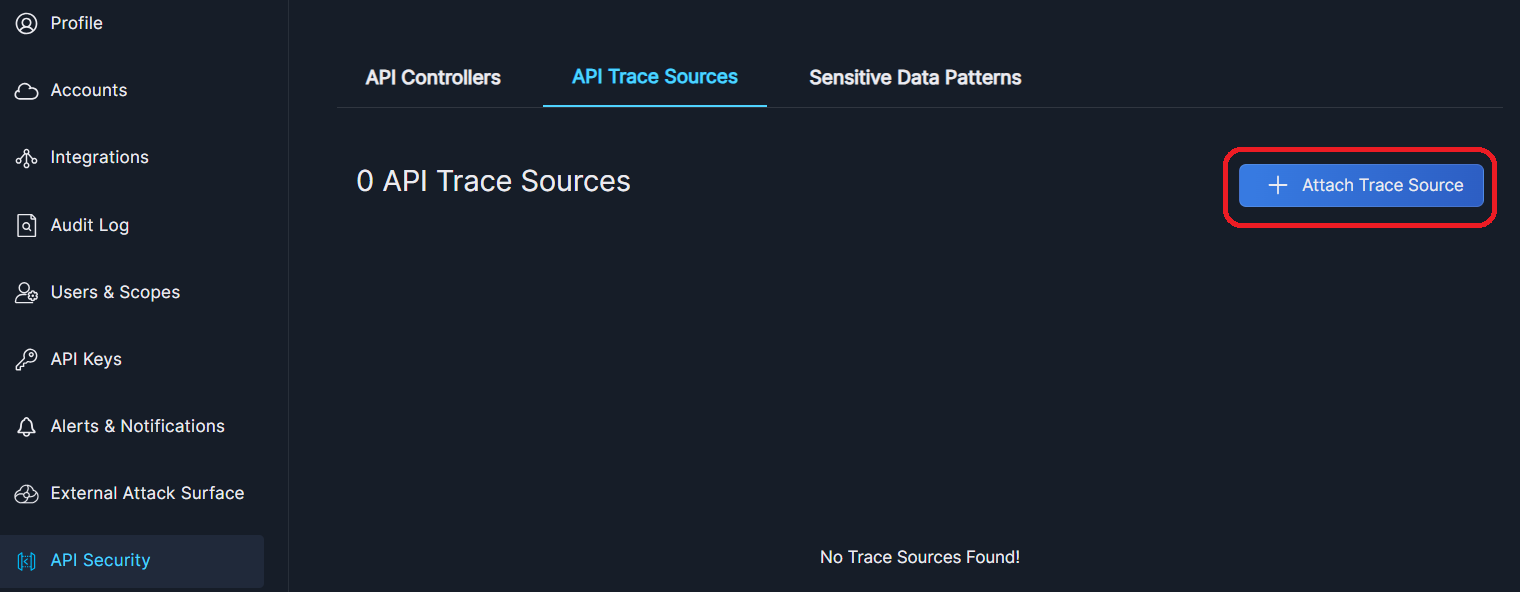
To get started, select Settings in the navigation pane, then API Security.
Go to the API Trace Sources tab, and select + Add Trace Source.
This will open the API Trace Source dialog box. Follow the on-screen steps, which are detailed below.
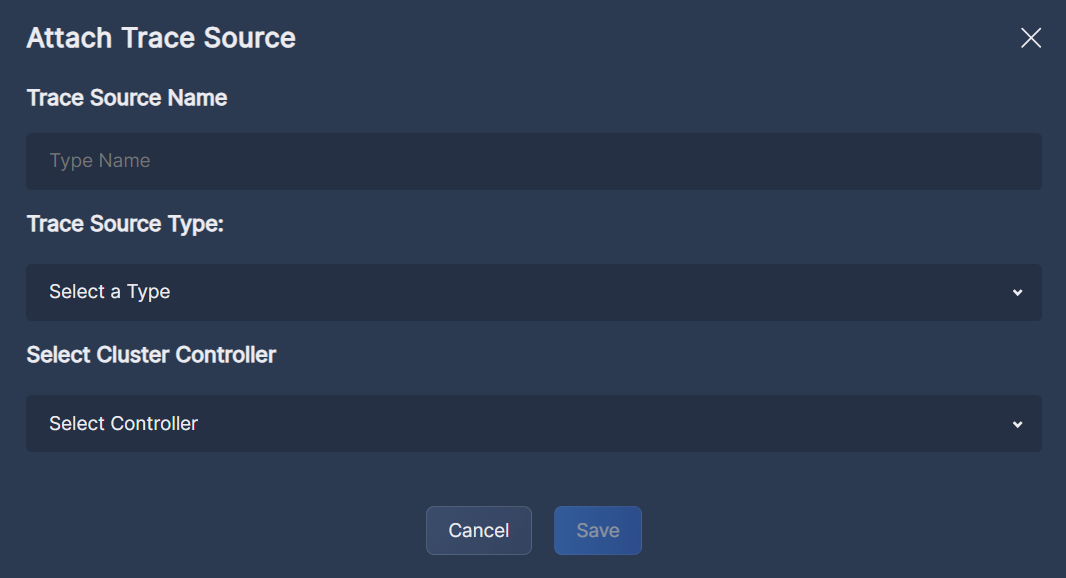
- Under Trace Source Name, enter a unique name for the API Gateway, as you want it to appear in Panoptica.
- Under Trace Source Type, select the gateway type you are attaching.
- Under Select Cluster Controller, choose the cluster to which this trace source will be attached. The drop-down list includes all of the controllers you deployed via Kubernetes Controller Onboarding.
If you don't see you controller in the list, the trace source you're installing may not be able to communicate with the controller. In this case, you need to Expose the API Controller for Trace Sources, to enable the communication. - Click Save.
Install the Plugin
The gateway you just defined will now appear in the list on the API Trace Sources tab with the status Pending Installation.
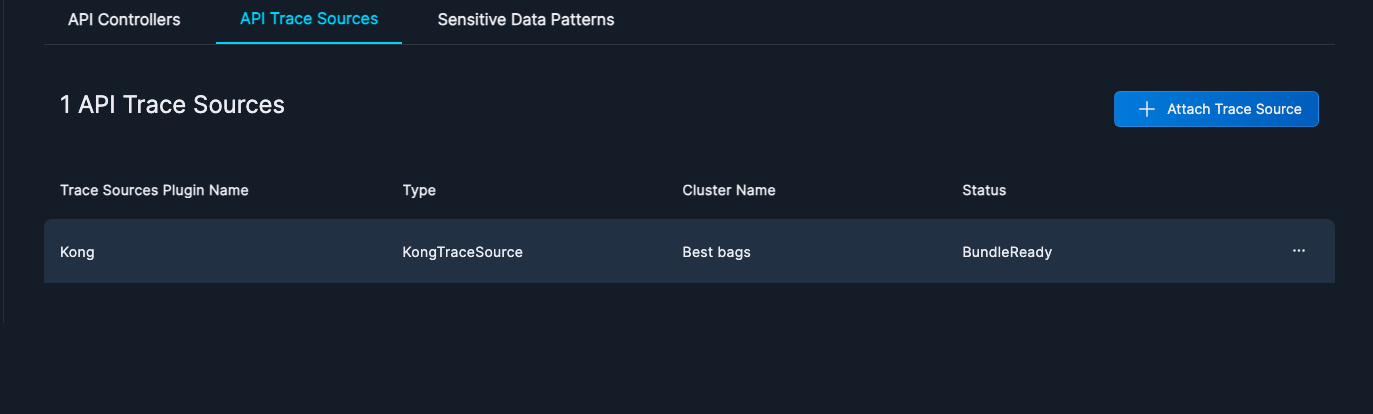
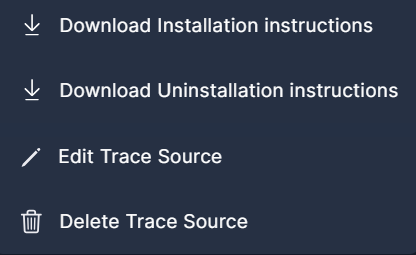
Click the three dots (•••) at the end of each line to open a drop-down list of actions you can perform on that trace source.
-
Select Download Installation Instructions to download the installation bundle.
Extract the package and follow the instructions in the readme.md fileFor detailed instructions, see Trace Source Installation.
-
Select Download Uninstallation Instructions for the steps required to uninstall a Trace Source plugin.
-
Select Edit Trace Source if you need to make any changes in the Trace Source configuration.
-
Select Delete Trace Source to remove this gateway from Panoptica.
Once the Controller is deployed in your cluster, and the Trace Sources are configured on your API Gateway, Panoptica will start displaying information about your APIs on the API Security tab in Panoptica's main navigation menu. See API Security to learn more.
Updated 10 months ago