Security Graph Query (Preview)
Organizations with extensive assets distributed across multiple cloud accounts, code repositories, APIs, SaaS applications, and Kubernetes clusters lack a single place where they can explore all their resources together. Dealing with disparate providers and platforms. security analysts and asset managers struggle to gain actionable insights, leading to operational inefficiencies and heightened security risks.
Panoptica collates information from multiple engines into a graph database, the core of Panoptica's solution. The graph database provides complete visibility into the topology of your environment, helping to identify your cloud resources and surface the most critical risks. Our attack path analysis, unified cloud inventory, security posture and root cause analysis help automate this process, so you can focus on solutions.
There are times, however, that you may want to take matters into your own hands. The Security Graph Query engine provides a visual and contextual approach to threat detection, incident response, and proactive threat hunting. It offers enhanced visibility, faster response times, and a deeper understanding of the security landscape.
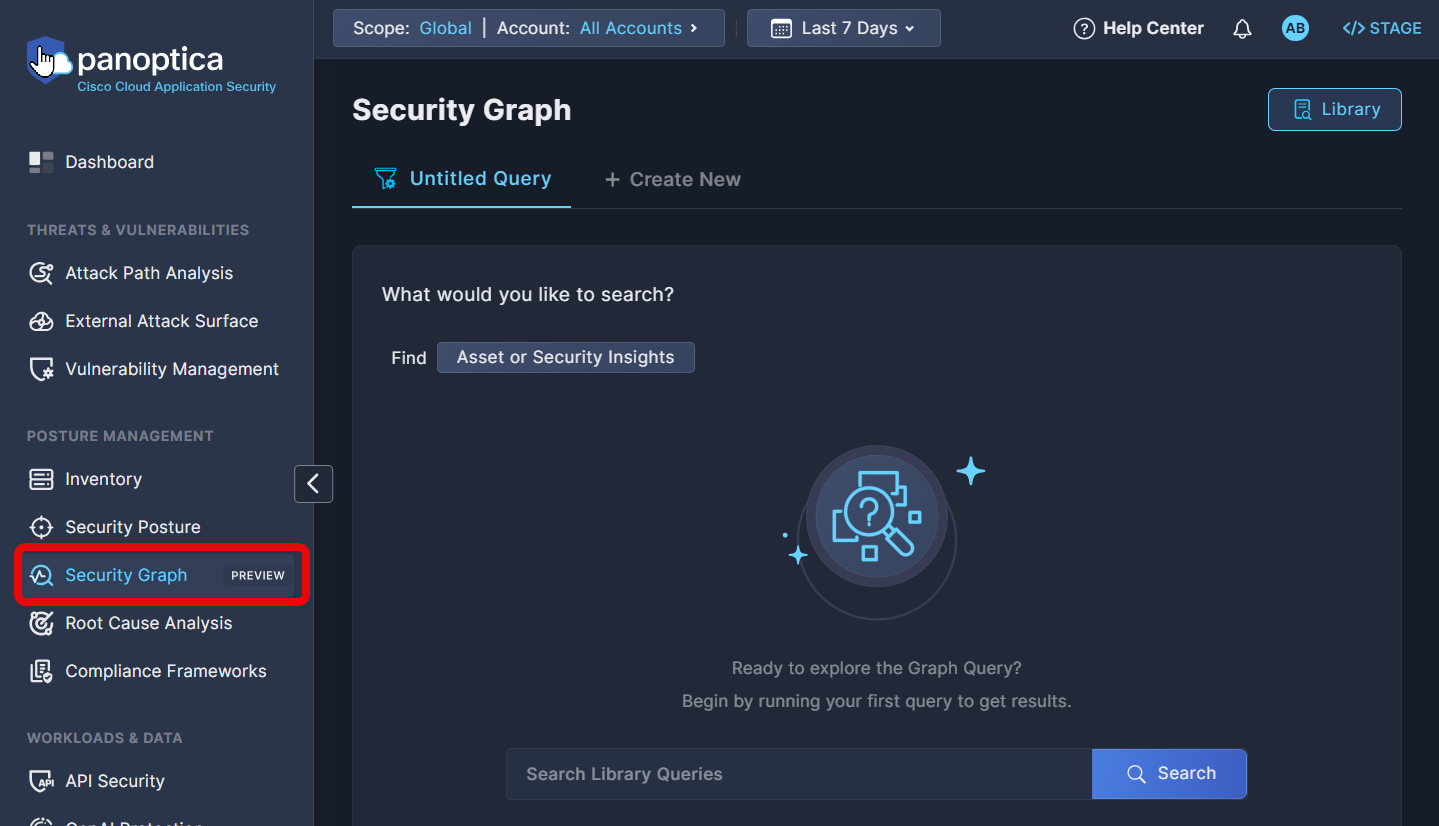
In the Panoptica console, navigate to Security Graph under Posture Management in the main navigation pane to start building graph queries. The graph query enables advanced, cross-platform search, combining your cloud assets with Panoptica's security insights.
You have the option of building your own search with the Query Builder, or selecting predefined searches from the Query Library.
Query Builder
The Query Builder enables you to create tailored queries that examine the properties of your assets, and/or explore security insights from across Panoptica's modules: CSPM, KSPM, API Security, Code and Build, and more. By adding advanced filters and relationship mapping between assets, you can customize tailored attack paths for targeted threat analysis.
To get started, click the Asset or Security Insights button in a blank Untitled Query screen.

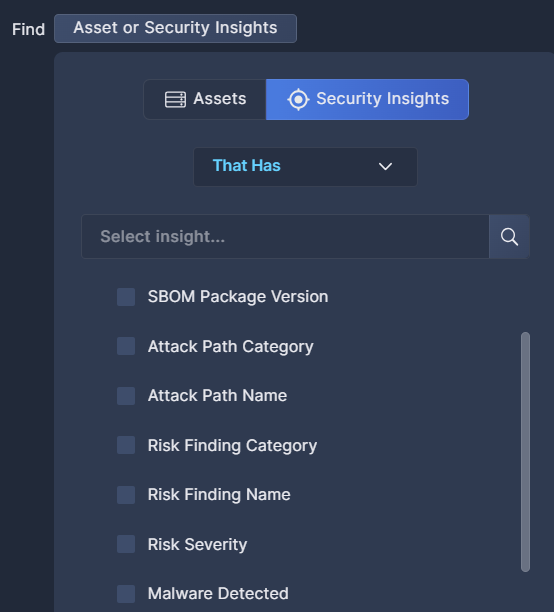
Choose either the Assets tab or the Security Insights tab to start building your query.
If you choose Assets, browse the list to find the Category, Asset Type, and/or Native Type (i.e. specific asset) you want to include in your query. The Asset Type includes results across vendors. For example, Storage Bucket includes storage assets from multiple providers.
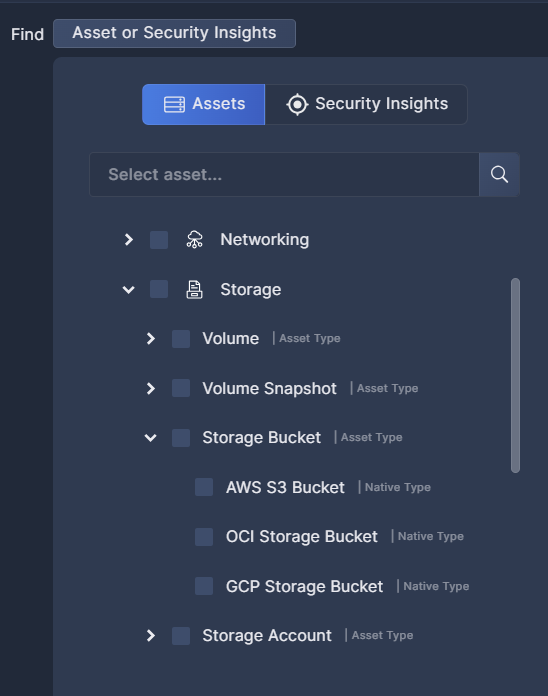
If you know the name of the category or asset you're looking for, you can type it into the search bar at the top to filter the list. Feel free to select multiple categories and/or assets.
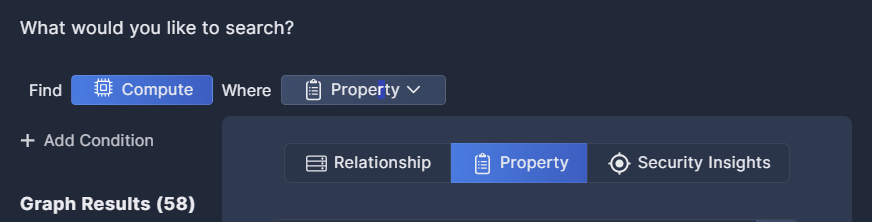
After selecting the base asset(s) for your query, you can filter the results according to specific criteria by clicking Properties. The list of properties ranges from identification of the asset itself to when it was observed, sensitivity, user fields like Favorite and Tags, OS or network properties, and more.
Alternatively, you can map any linkage between different assets in your environment by clicking Relationship; or identify any connection between your assets and Panoptica's Security Insights
Security Insights is where you correlate between the asset(s) in your query and Panoptica's security findings. By integrating Attack Paths or Risk Findings or Vulnerabilities that Panoptica has discovered with the assets you've selected, the Query Builder enables you to customize those insights for the specific assets you're investigating.
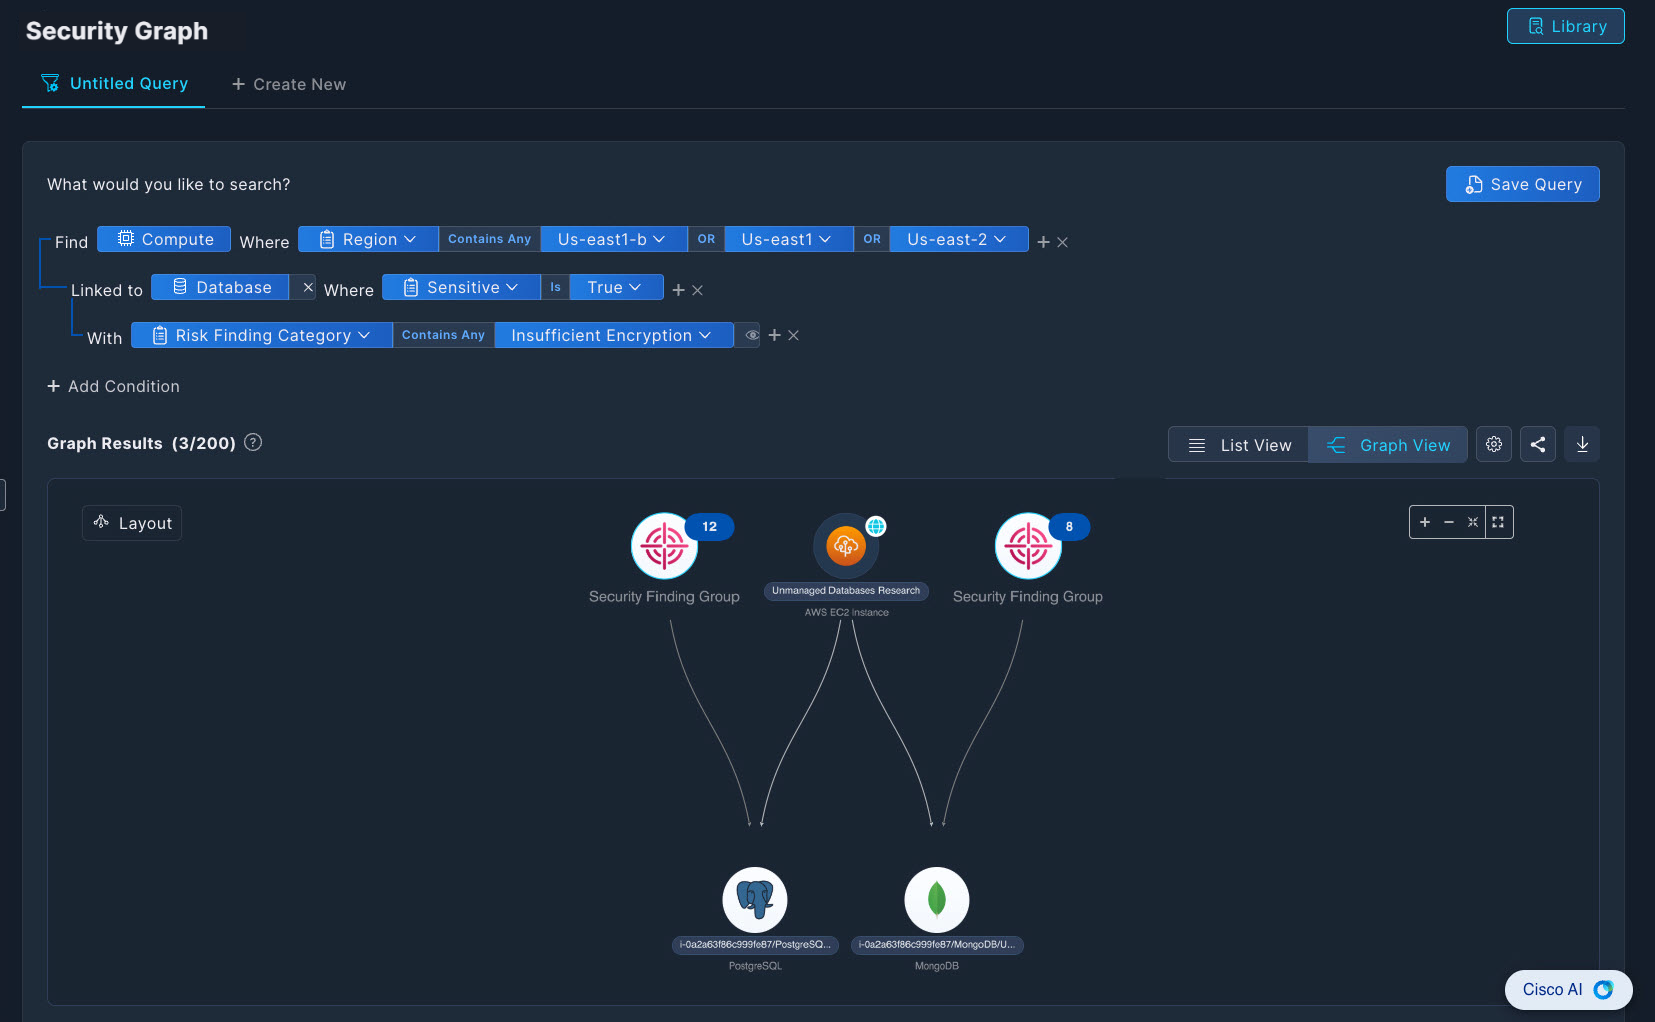
Click + Add Condition to expand your query with additional parameters. The Query Builder allows you to specify exactly what assets, properties, and security insights you're looking for.
This example queries for compute assets in three US East regions linked to sensitive databases with insufficient encryption.
To compare different queries, click + Create New at the top of the Query Builder to start building another search. You can create up to five queries at a time.
To reuse a query definition in the future, click Save Query to keep it in the Query Library. Note that only users with an Owner role have permission to save queries to the Query Library.
Role-Based Access ControlAll users are entitled to create queries for personal use. However, only users with an Owner role have permission to save, edit, and delete queries in the Global Query Library.
See User Management for details on user roles.
Graph Results
The Graph Results panel is where you can visualize the results of your searches in graphical form. Notice how the graph updates in realtime as you build the query.
The nodes in the graph are aggregated by type for clearer visibility. Click any node to investigate further, and access details of each asset with additional security context.
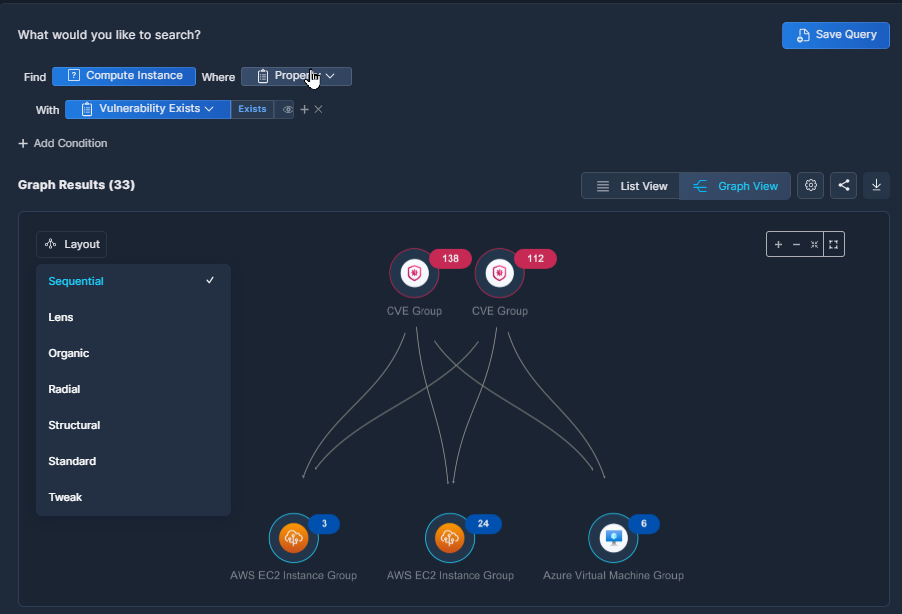
Pull down the Layout menu to choose the style of graph you'd like to view. The information will be the same, but other layouts may help you visualize the findings better.
The menu bar at the top of the graph provides additional options for managing the query results.
- Click the Settings (gear cog) icon to choose the search mode. By default, Panoptica returns the first 200 results in a Quick Search. Select Full Search to conduct a more thorough search of your resources.
- Click the Share icon to copy a URL link for a page showing the displayed graph. This is useful for collaboration.
- Click the Download icon to export the query results in CSV format. This is useful for record-keeping and for sharing this information with others.
List Results
To view the query results in table format, displaying more details about each asset, click List View.
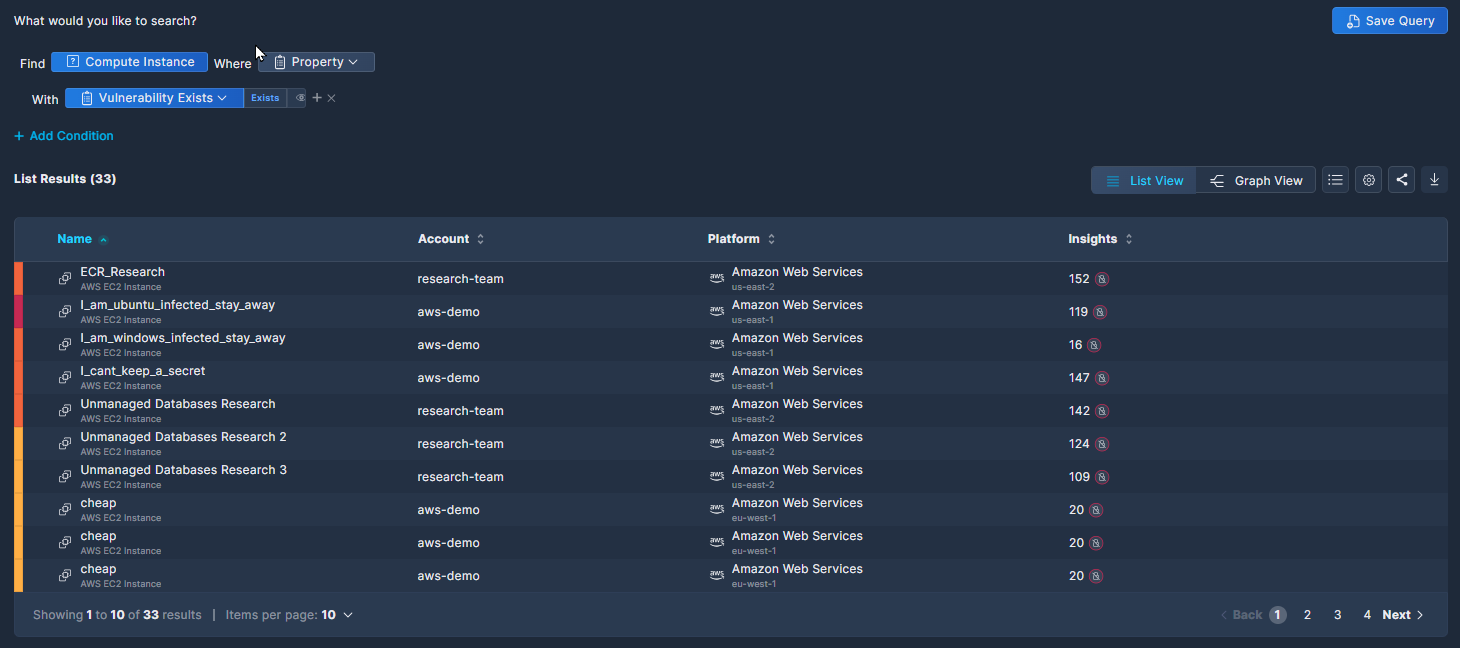
The columns displayed in the List View change dynamically according to the query definition. Click any record in the table to investigate further, and access details of each asset with additional security context.
In addition to the Settings, Share, and Download icons that were available in Graph View, the List View adds a Columns icon, where you can select which columns to view.
Query Library
To view the queries that you have saved, click the Library button in the top right corner of the Security Graph Query screen.
In addition to your own queries, the Query Library includes a number of out-of-the-box queries that Panoptica's security research team has compiled for your use. These can be identified by the author: "@Panoptica". We will continue to update these public queries in accordance with real-world security findings and recommendations.
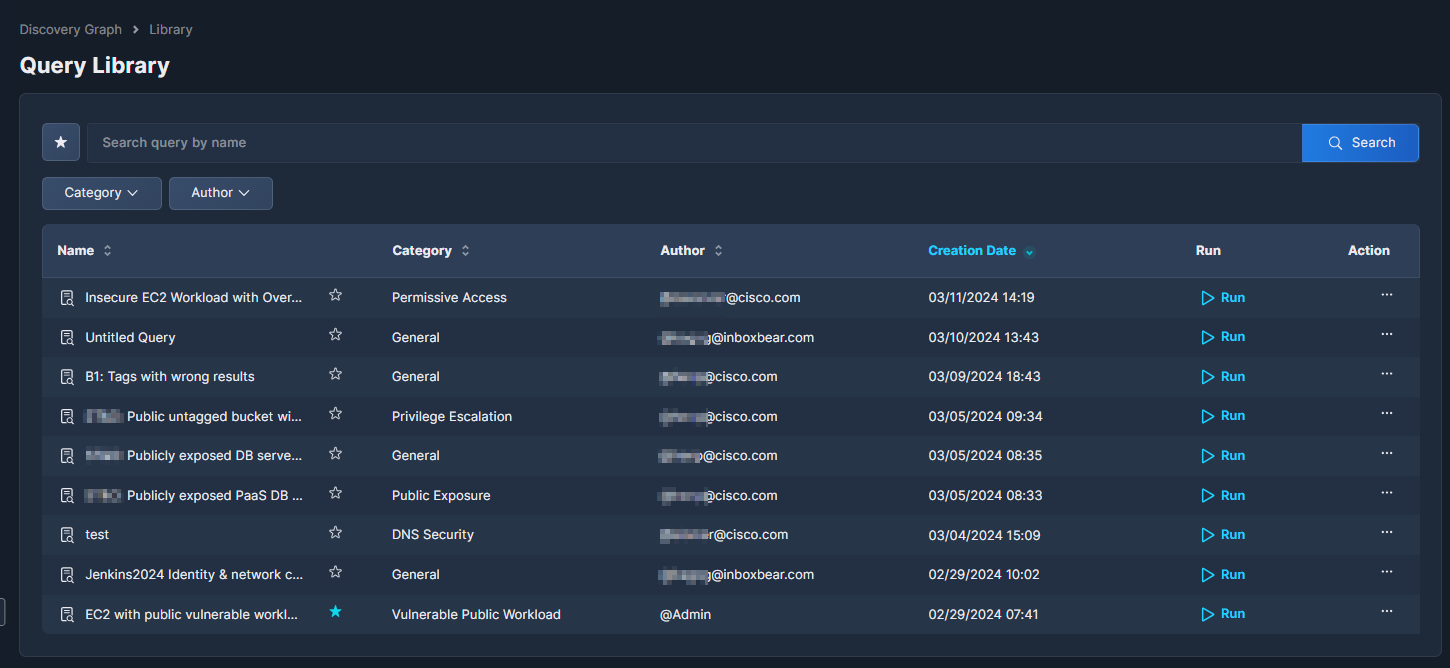
Users with an Owner role can click the three dots (•••) at the end of each record to open a drop-down list of actions that can be performed on that query. Most actions can only be performed on the queries that you built; the only option for built-in Panoptica queries is View Description.
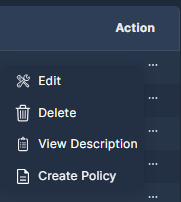
Edit: Update the query description and/or definition.
Delete: Erase a query from the library.
View Description: See more details about the query. To edit the description of one of your own queries, select Edit.
Create Policy: Define a Security Graph Rules based on this query. See Policy Management (Preview) for details.
You can only create policy rules from queries that you saved in the Query Library, not the pre-defined Panoptica queries. To create a policy rule from a Panoptica query, run the rule, and click Save As.... A copy of the Panoptica query will appear in your Query Library, from which you can create a policy rule.
Updated 10 months ago