Kubernetes Onboarding using Console UI
The Panoptica Kubernetes controller can be deployed in any K8s cluster. Once the controller is deployed, your cloud resources are integrated with Panoptica, providing you all the benefits of Panoptica security: inventory scanning, attack path analysis, vulnerability management, root cause analysis, compliance, and more.
Integrating Panoptica with your resources is a two-step process: when you create a new integration in the Panoptica platform, you then install the controller in your cluster, using a customized Helm command. Similarly when you update the integration on the platform, you also need to run a Helm upgrade command. And when you delete the cluster in the platform, you uninstall it from your cluster.
For more information – including prerequisites and feature details – please visit Kubernetes Controller Onboarding
Integrating a Kubernetes cluster
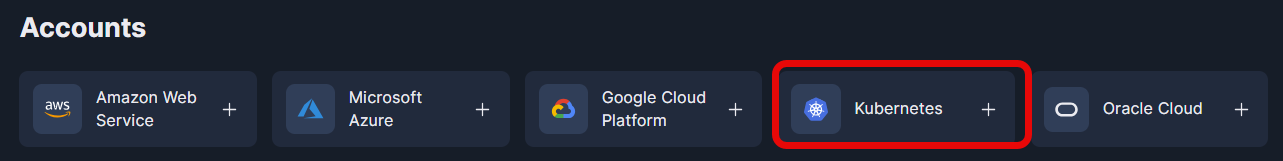
To get started, log into Panoptica and select Settings in the navigation pane, then the Accounts tab.
Choose Kubernetes to open the Kubernetes registration overlay.
Register cluster
When the Kubernetes registration form opens, follow the on-screen steps, which are detailed below.
-
Enter a unique name for your Kubernetes cluster, as you want it to appear in Panoptica. This field is mandatory.
-
Select which feature(s) you want to include in the controller being deployed. In the example below, KSPM and Smart CDR will be included.
-
KSPM (Kubernetes Security Posture Management) continuously scans and protects your cloud workloads, identifying risks associated with misconfigurations and vulnerabilities.
Image scan is limited to 2GB. KSPM is always selected by default. -
Smart CDR (Cloud Detect and Response) enables K8s runtime protection, so you can discover live security events as they happen. In addition to monitoring the activity in real-time on the Smart CDR tab, Panoptica can also issue alerts via the platform of your choice, according to severity levels that you configure. See Notifications and Alerts under Platform Management for details on configuring notification channels and CDR alerts.
-
API Security collects and analyzes live API traffic, automatically building a catalog of the APIs in your environment, including the APIs you expose (internally and externally), as well as third-party APIs your applications consume. Along with trace source collectors, Panoptica's API Security controller analyzes risks and vulnerabilities, assigns risk scores, and helps maintain your security posture. See API Security for details.
Note that configuring Panoptica to secure your APIs is a two-step process. After deploying the API Security Controller in your cluster, you then need to attach the Trace Sources by deploying a plugin to your API gateway.
-
-
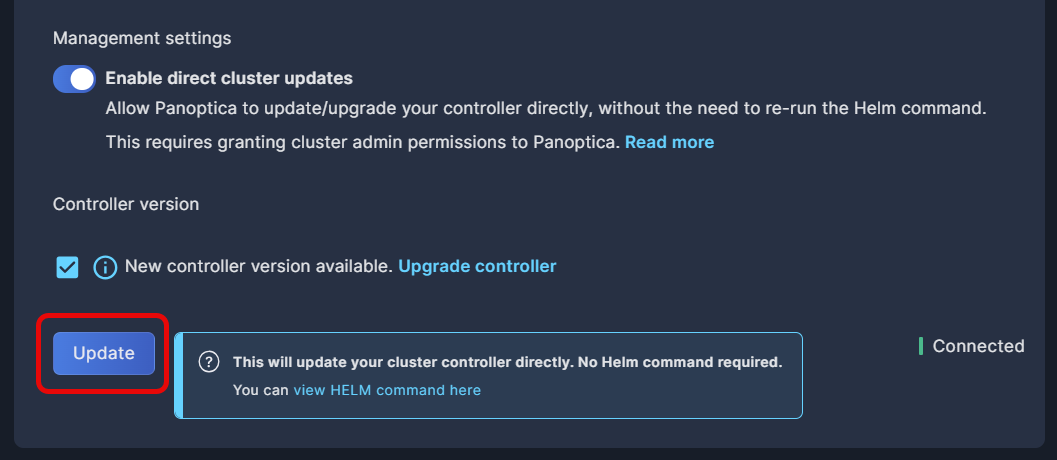
Choose whether you want to Enable direct cluster updates, which will allow Panoptica to update the controller preferences and/or upgrade the version automatically, without the need to re-run the Helm command.
Admin Permissions RequiredEnabling direct cluster updates requires granting Panoptica admin permissions to your cluster.
-
Click Register to define the cluster name with your preferences in Panoptica.
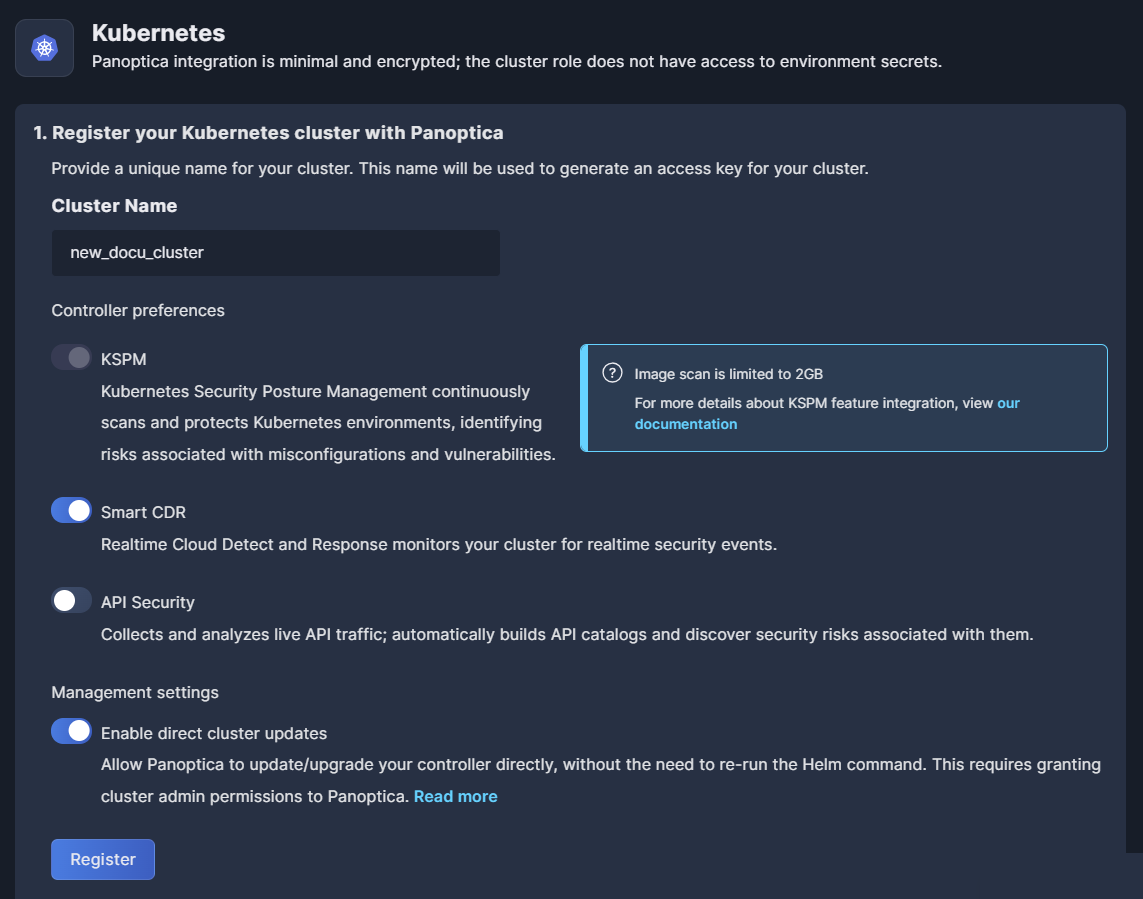
After registering the name and your preferences, the cluster status will be "Pending" until you complete the installation in your cluster.
Install controller
Once registered, Panoptica will generate a secret token for your cluster, and the Helm command will become visible.
Copy the Helm chart command, which you'll use to install the controller in your cluster. For convenience, use the Copy button in the corner of the text window.
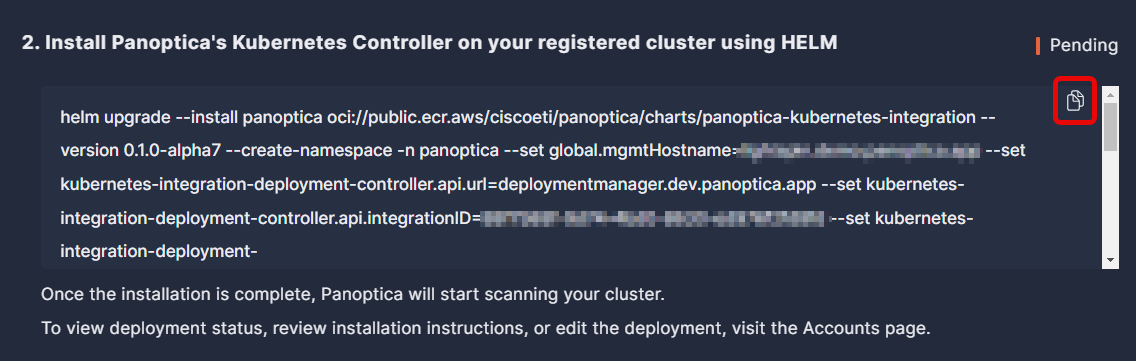
Now go to your machine or VM and run the Helm chart installation command to install the Panoptica controller in your cluster. Note that the installer requires admin permissions to the cluster in order to deploy the controller. Even if you have enabled direct cluster updates, the controller needs to be installed manually the first time.
You can further customize the controller deployment using the Helm chart values listed at Advanced Kubernetes Integration to specify additional configurations.
RedHat OpenShift InstallationIf you are installing the Panoptica controller in a RedHat OpenShift cluster, you must append the following string to the Helm upgrade command:
--set global.isOpenShift=true
Image SizeIf your containers are larger than 2GB, the scan may fail due to lack of memory. To overcome this, you need to raise the scanner memory limit by adding this setting to the Helm command.
In this example, the memory is set to 5GB. Adjust the parameter as needed.
--set k8sec-controller.imageAnalysis.sbom.resources.limits.memory=5000Mi
API Trace Sources
If you included API Security in your Preferences, you need to configure Trace Sources to gain visibility into API traffic across your workloads—as well as to/from external sources. This is done by deploying a plugin to an API gateway, which communicates with the Panoptica controller deployed on the cluster.
Navigate to the API Security tab in the Settings pane, and click API Trace Sources to configure these plugins.
See API Trace Sources for details.
Accounts table
Once the controller has been deployed in your cluster, its status in the Accounts table will change from "Pending" to "Connected".
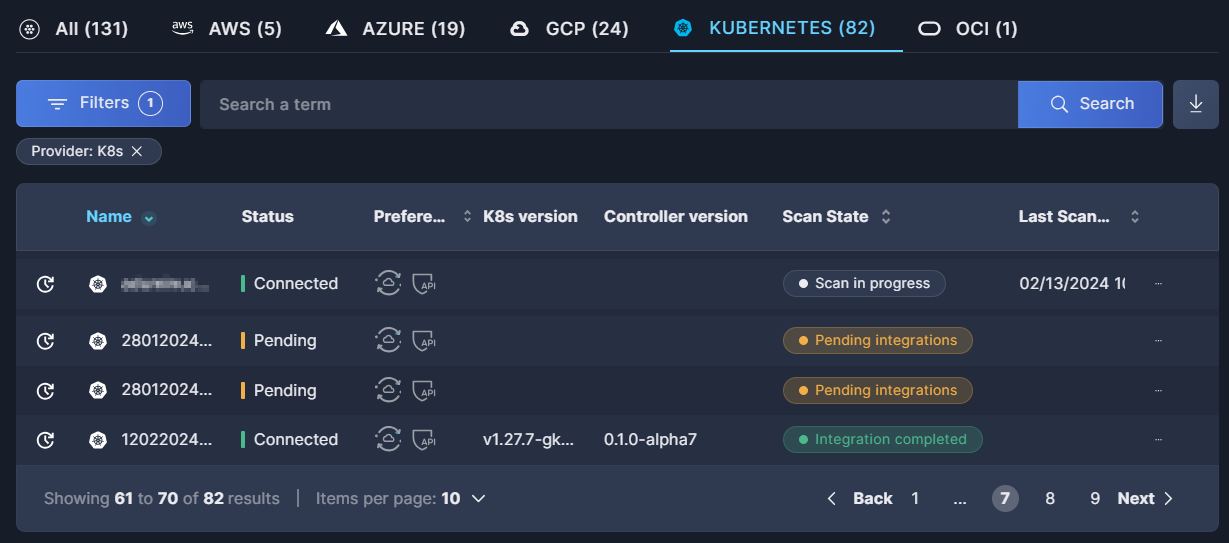
For further details, see the documentation on the Accounts table.
Action menu
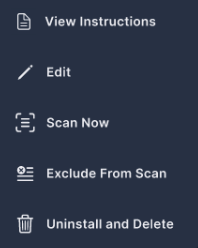
In addition to information regarding the accounts installed, you can also make changes to the accounts via the action menu. Click the three dots (•••) at the end of each line to open a drop-down list of actions you can perform on that controller:
-
To review instructions for deploying the Panoptica controller in your cluster, select View Instructions.
-
To change the controller's configuration, select Edit. The Kubernetes configuration overlay will open.
-
Make whatever changes you want to the controller preferences.
-
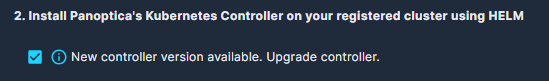
If there is a new controller version, updating the configuration includes an upgrade to the controller, by default. If you prefer to maintain your current controller version, uncheck the box beside "New controller version available."
-
If you have enabled direct cluster updates, simply click Update. This will update the account in Panoptica as well as the controller in your cluster.
-
If you have not enabled direct cluster updates, click Update to receive a new Helm command in the configuration window. Copy the command and apply it in your Kubernetes cluster.
-
-
To initiate an immediate scan, select Scan Now.
-
To ignore a cluster, without deleting it, select Exclude. This is useful for temporarily halting scans without offboarding the cluster.
-
To remove the controller from Panoptica, and uninstall the controller from your cluster, select Uninstall and Delete.
One at a time, pleaseIf you plan to re-deploy the Panoptica controller to the same cluster, you must wait for the deletion to complete before restarting the process.
It might be better to consider editing and/or upgrading the deployment, rather than deleting and reinstalling.
Upgrade Controller
If your Panoptica Kubernetes controller is out of date, you will see an orange indication beside the Controller version in the Accounts table. Follow these steps to upgrade the controller:
-
Click the three dots (•••) at the end of the line to open the Action menu.
-
Select Edit to retrieve an updated Helm chart command.
-
Make sure "New controller version available" is checked.

-
If you have enabled direct cluster updates, simply click Update. This will update the account in Panoptica as well as the controller in your cluster.
-
If you have not enabled direct cluster updates, you'll need to update your cluster manually:
- Click Update to receive a new Helm command in the configuration window. Copy the new Helm command, using the Copy button in the corner of the text window for convenience.
- Apply the updated Helm command in your machine or VM to update your controller.
If the Controller version is listed as "legacy", please follow the procedure at Kubernetes Controller Migration.
Updated 10 months ago