Root Cause Analysis
After discovering all the attack paths, security issues, and vulnerabilities in your environment, Panoptica can help identify the underlying root cause, enabling you to remediate a number of risks in a single action. By addressing a single issue identified as the root cause, you can effectively address multiple security gaps at once.
Our contextual graph-based engine identifies the root cause behind an attack path, enabling you to resolve the vulnerability a potential malicious actor might use to exploit your environment. This also dramatically lowers the volume of alerts, reducing your workload and allowing you to focus on the issues that are most critical and most impactful.
Solution Overview
Applying Panoptica's Root Cause Analysis provides the following solutions:
Root Cause Distribution: Panoptica provides visibility into the root cause of all risks detected in the cloud environment. This helps security teams identify the root cause of issues and take corrective action to prevent them from recurring.
Impact Score: Panoptica assigns an impact score for each root cause, which indicates the total impact of the identified issues on the account's health score. This allows security teams to prioritize remediation efforts based on the severity of the risks.
Ready-Made Remediation: You can find Terraform, JSON, or manual steps to remediate issues, providing your security teams the tools needed to take immediate action.
Workflow: Panoptica integrates with your Workspace Management tools, such as Jira or ServiceNow. This allows security teams to assign tickets to team members directly from Panoptica, and track the progress of remediation efforts.
Go to the Root Cause Analysis tab under Posture Management to view the results of Panoptica's root cause analysis, and start addressing your security issues more effectively.
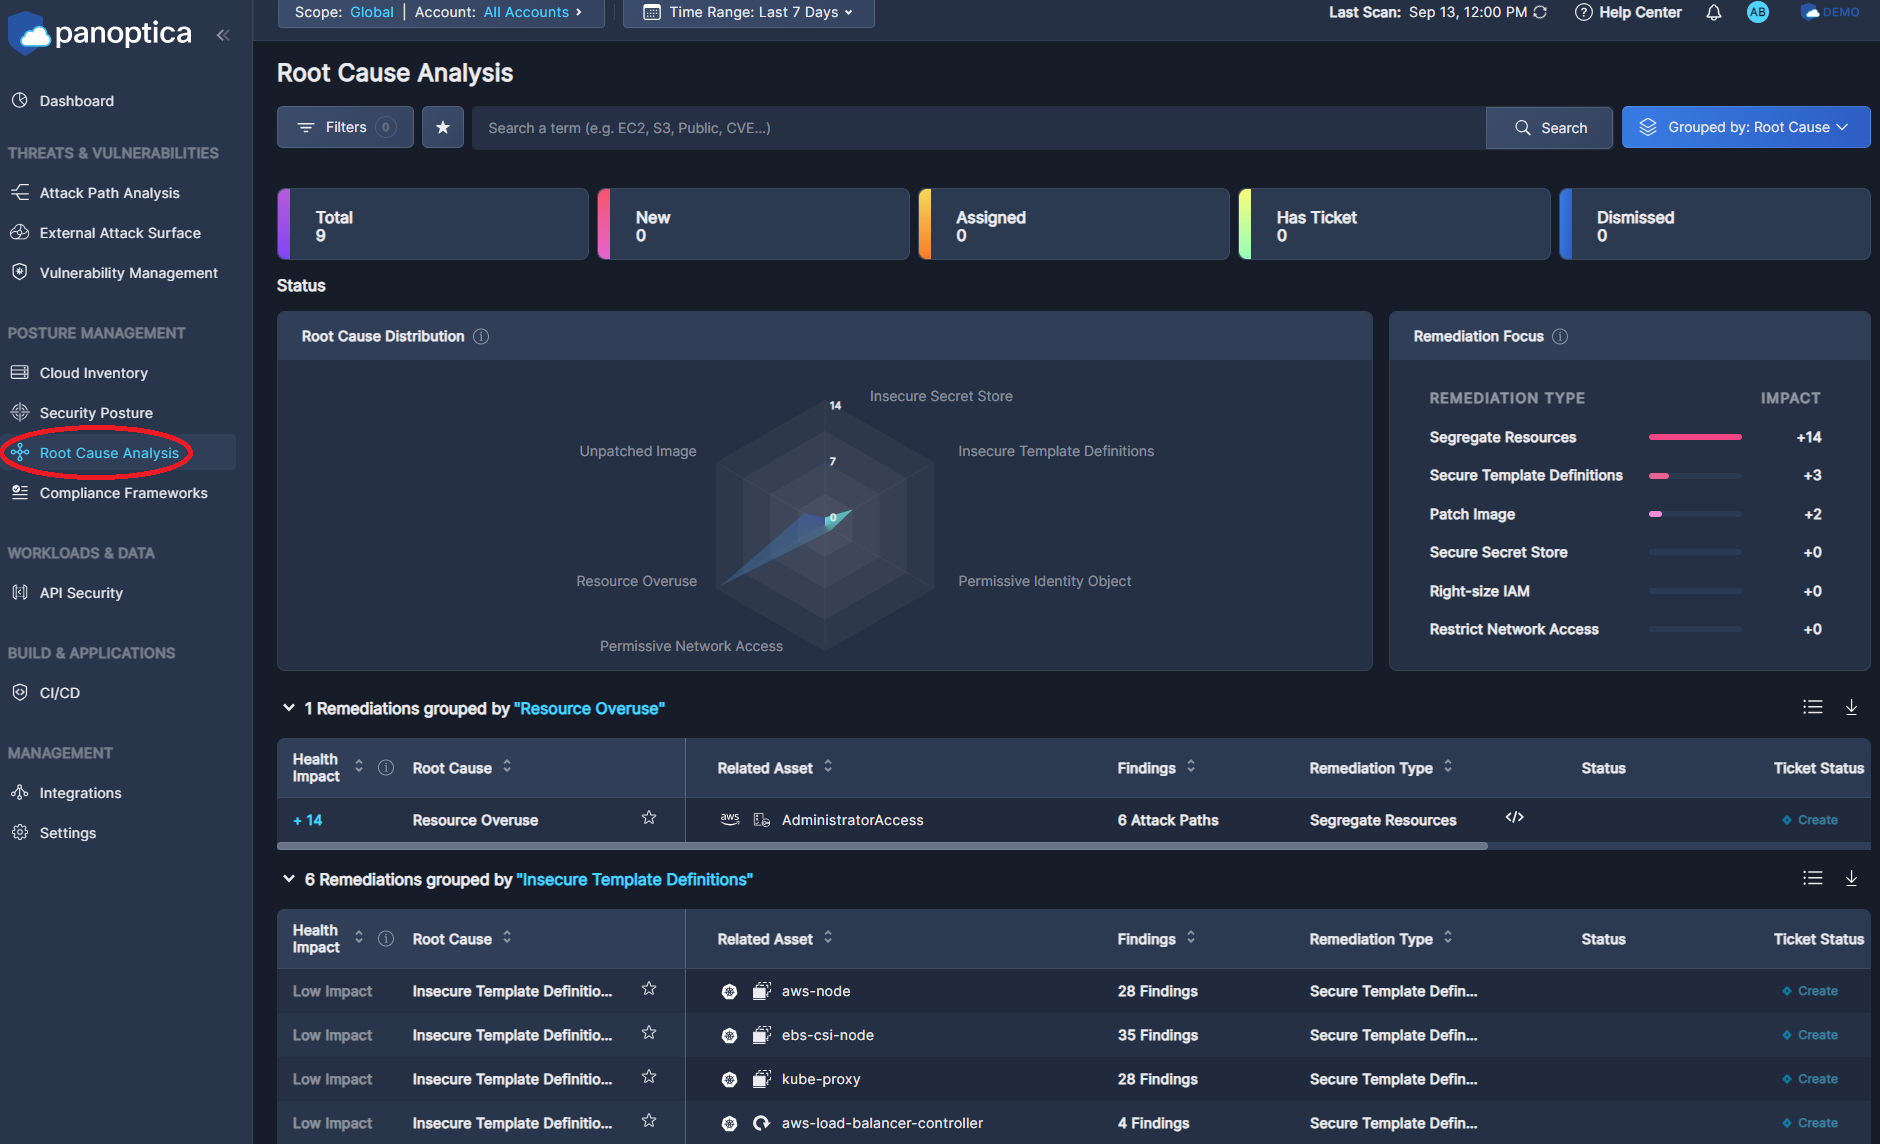
Fig 1. Root Cause Analysis tab
Filter, Search, and Group
Use the Top Bar Filter to filter the findings across the platform by Scope, and Account using the drop-down lists at the top. You can also select the time frame during which the issue was last observed.

Fig 2. Top Bar Filter
You can further refine the results using predefined filters, custom queries, and aggregation:
- Use the drop-down Filter option to narrow the results by: Service Provider, Root Cause, Remediation Type, Account, Account Score, Related Assets, Root Cause Status, and Ticket Status.
- View only your Favorite assets by clicking on the star icon ✩, in the Filter bar.
- Use the Search bar to look for a text string from a root cause, asset name, etc.
- Click Grouped by to aggregate the results displayed by Root Cause, Account, or Remediation.

Fig 3. "Filters", "Search", and "Group by" tab
The dashboard below the filter bar display high-level summary cards, indicating the number of root causes identified, as well as how many are new, assigned, ticketed, and dismissed. You can use these cards as "quick filters" to track the root cause remediation progress.

Fig 4. Recommendation breakdown by categories.
Root Cause Distribution
The Root Cause Distribution widget helps you visualize how the different issues contribute to your account's health score. The radar chart covers the six categories of root causes Panoptica identifies:
- Insecure Secret Store − when a single secret value is exposed as cleartext in a number of assets. By securing the single secret, you can remediate multiple security findings at once.
- Insecure Template Definition − when a single template (such as K8s deployment) has security issues, which are propagated to the child instances. By correcting the template, you can remediate multiple downstream issues.
- Permissive Identity Object − when a single identity object (such as AWS IAM Policy or GCP Roles) has overly permissive access permissions, and is used by multiple Users/Groups/Roles. By restricting the identity object to the principle of least privilege, you can remediate all of the identities using that policy or role.
- Permissive Network Access − when a fully open security group (0.0.0.0/0) is connected to compute assets in multiple attack paths. By restricting network access to the security group, you can remediate all of the downstream attack paths.
- Resource Overuse − when the same at-risk resource appears in multiple attack paths. Securing that asset will remediate the risk over all relevant attack paths.
- Unpatched Images − when a compute image or docker image comes with inherent vulnerabilities, which are replicated across all compute assets or containers that use the vulnerable image. By updating the image with the latest security patches, you can remediate all of the assets it generates.

Fig 5. The Root Cause Distribution radar chart.
The impact points in the graph indicate how many points will be added to your security score by remediating that root cause. You can filter the recommendations by clicking on the root cause types.
For more information, see Use Cases for Root Cause Analysis.
Remediation Focus Chart
The Remediation Focus chart lists the remediation actions, sorted according to which will have the greatest impact on your overall security score. This enables you to prioritize which actions will address the most risks with the least effort.
The table is broken down by remediation types, which correlate to the categories identified in the Root Cause Distribution widget:
- Right-size IAM − to address Permissive Identity Object issues
- Segregate Resources − to address Resource Overuse issues
- Restrict Network Access − to address Permissive Network Access issues
- Patch Image − to address Unpatched Images issues
- Secure Template Definitions − to address Insecure Template Definition issues
- Secure Secrets - to address Insecure Secret Store issues

Fig 6. The Remediation Focus widget.
The Impact column indicates how many points will be added to your security score by remediating that issue. For more information, see Use Cases for Root Cause Analysis.
Remediations Table
The Remediations table below the widgets lists all of the root causes Panoptica has identified in your environment. In addition to the Root Cause category, the table also displays any Related Assets, the number and type of Findings, Remediation Type, Status (resolved or not), Ticket Status in an integrated Task Management tool), who it is Assigned to within Panoptica, and when the issue was last seen.
- There are a number of columns, so you may need to scroll laterally to view additional information.
- The table view can be customized using the Filter, Search, and Group functions above, or by clicking a quick-filter in the widgets.
- Select which columns are displayed by clicking the Columns button, in the upper right.
- The list of root causes can be downloaded in CSV format, for further review and analysis using Excel or any similar tool.

Fig 7. The Remediations Table
Click the three dots (•••) in the last column to open a drop-down list of actions you can perform on each root cause in the table.
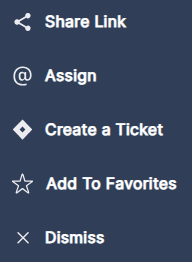
Fig 8. Action Menu
- To share information about this remediation, click Share Link to generate a URL
- To assign responsibility for this remediation within Panoptica, click Assign. This is distinct from creating a ticket in an integrated Task Management tool, like Jira or ServiceNow.
- To open a ticket in whichever Task Management tool you have configured in Panoptica, click Create Ticket
- To bookmark this remediation item, select Add to Favorites
- To acknowledge this item, and hide alerts related to it, click Dismiss
If there are a large number of remediations listed, you can define how many items appear on each page at the bottom of the table.
Explore and Remediate Root Causes
Click on any row in the list to pop up additional information about that issue in a side drawer. The detailed view enables you to deep-dive into the root cause that Panoptica has identified, so you can understand, prioritize, and remediate it easier.
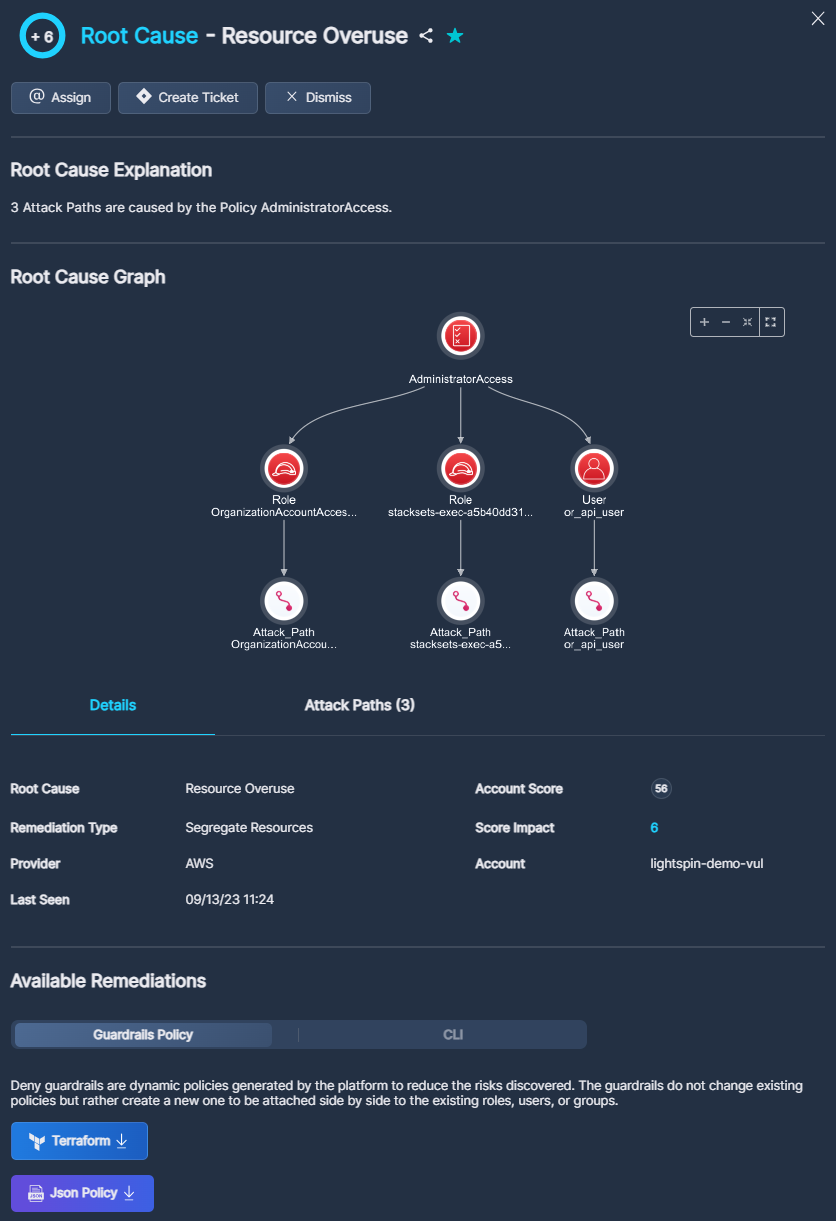
Fig 9. Side Drawer Details
The buttons at the top of the pop-up window enable specific actions on that issue:
- Click the Share icon to retrieve a URL of this detail screen
- Click the Star icon to bookmark this issue, and add it to your Favorites
- Click Assign to refer this issue to any user within Panoptica. This is distinct from creating a ticket in an integrated Task Managementtool, like Jira or ServiceNow.
- Click Create Ticket to open a ticket in whichever Task Management tool you have configured in Panoptica
- Click Dismiss to acknowledge this issue, and hide alerts related to it,
Root Cause Explanation
Under Root Cause Explanation you will find a brief description of the issues behind this root cause. The description includes the number of instances, the type of finding—Asset, Security Finding, Vulnerability, or Attack Path—and the specific element triggering the issue.
Root Cause Graph
The diagram under Root Cause Graph enables you to easily visualize how a single root cause can adversely impact the security of your environment. Hover over each node of the graph to view additional details about that element, be it a deployment, daemon set, role, policy, function, etc. This is where you can also dive deeper into the root cause.
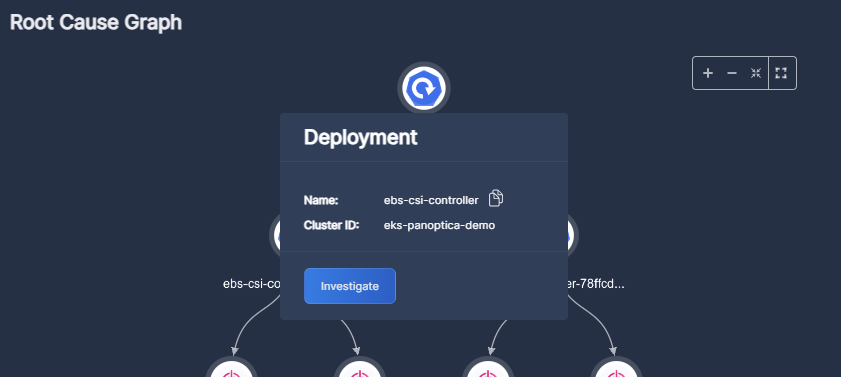
Fig 10. Root Cause Graph
Click Investigate to open a detailed view of that element in a new tab. The detailed view will display everything Panoptica can tell you about that element, in the relevant tab of the Panoptica console: Attack Path Analysis, Vulnerability Management, Cloud Inventory, or Security Posture.
Additional Details
Below the Root Cause Graph, the Details tab provides much of the same information available in the Remediations Table, in addition to:
-
Provider - Cloud service or K8s (Kubernetes)
-
Account Score
-
Account
The tab beside Details lists all of the findings triggered by that single root cause. The tab name will vary according to the type of finding: Attack Path, Asset, Security Finding, or Vulnerability.
Available Remediations
When available, Panoptica supplies ready-made Terraform or JSON policy to remediate the root cause. Depending on the nature of the solution, this could be CLI commands, or a Terraform or JSON file that you can download from the console.
.gif")
Fig 11. Assign, create the ticket, and download a Terraform or JSON policy.
Updated 10 months ago