Cloud Inventory
Panoptica's Cloud Inventory provides real-time visibility into assets across your cloud providers. You can filter assets by a number of parameters; customize your search using our advanced query language; group assets for simpler review; investigate attack paths; and remediate most issues in a few steps.
Go to the Cloud Inventory tab under Posture Management to view details and analysis of the assets Panoptica has identified across your environment.
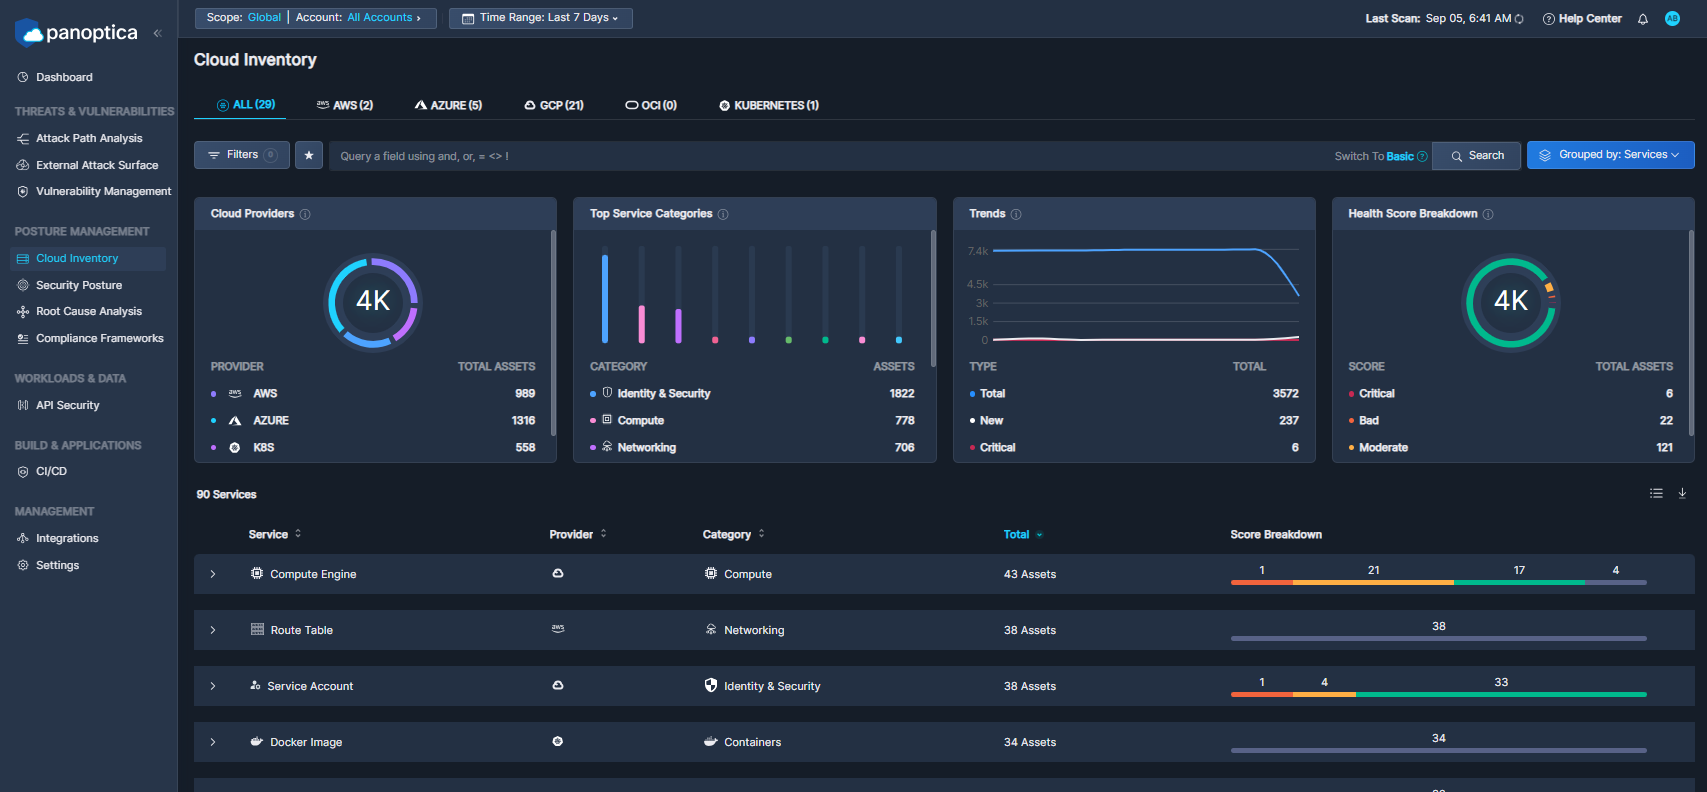
Fig 1. Cloud Inventory tab
Use the Top Bar Filter to filter the findings across the platform by Scope, and Account using the drop-down lists at the top. You can also select the time frame during which the asset was last observed.

Fig 2. Top Bar Filter
Filter, Search, and Group
You can further refine the results using predefined filters, custom queries, and aggregation:
- Use the drop-down Filter option to narrow the results by: Service, Provider, Category, Account, Risk Severity, Risk Score, User Actions, Labels, Risk Engine, Region, and Favorites.
- View your Favorite assets by clicking on the star icon ✩, next to the Filter option.
- Compose simple Queries to look up a wide selection of fields.
Click the circled question mark for the full list of query options:- Reference - Details on logical and comparison operators, and information on strings.
- Examples - A list of examples that you can click on to automatically add to your search.
- Fields - A list of fields that can be used in the query language search. A field in Panoptica is a word that represents a Panoptica field.
- Click Grouped by to aggregate the results displayed in the Assets Table by Services, Accounts, Categories, or Severity.

Fig 3. "Filters", "Query", "Search", and "Group by" tab
Cloud Inventory Dashboard
The Cloud Inventory dashboard is made up of four widgets that provide a snapshot of your cloud inventory, gleaned from the accounts you have onboarded.
- The Cloud Providers widget displays the total number of assets in your environment, by provider. Click on a provider name in the list to set an instant filter.
- The Top Service Categories widget depicts the most common category of assets per service category. Click on a category name in the list to set an instant filter.
- The Trends widget displays the asset status over time, and indicates the percent change of total, new, and critical assets.
- Health Score Breakdown breaks down the number of assets into four health score levels: Critical, Bad, Moderate, Good. Click on a risk level in the list to set an instant filter. See Asset Health Score for more information on asset health.

Fig 4. Asset Management Dashboard
Asset Table
Below the widgets, Panoptica lists the discovered assets, filtered and grouped according to your settings. The table can be sorted by Service, Cloud Provider, Category, or Total number of assets.
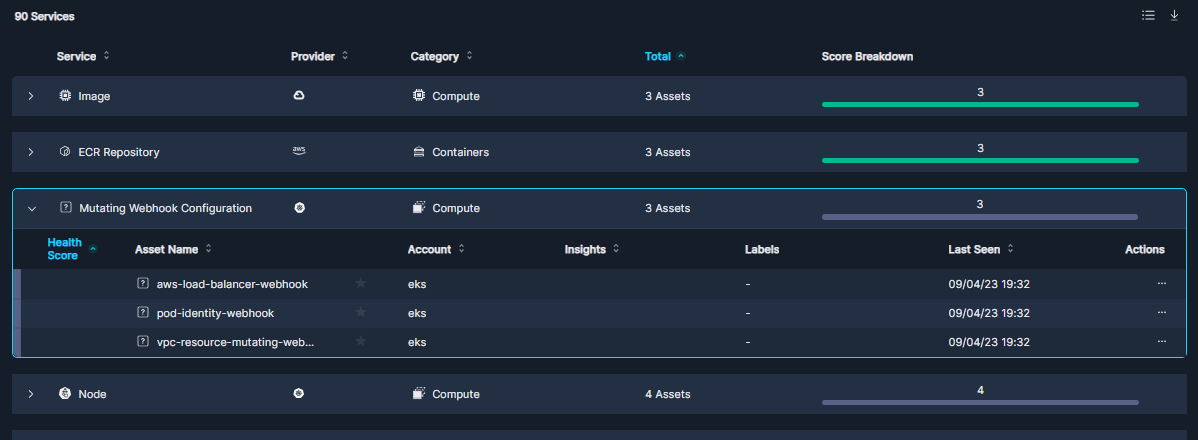
Fig 5. Asset Table
Select which columns are displayed by clicking the Columns button, in the upper right corner of the table.
Click the down arrow <↓> beside the Columns button to download the list of assets in JSON or CSV format.
Expand any group to view a detailed lists of assets in that group, which can be further sorted by Health Score, Asset Name, Account, Insights, and when it was Last Seen.
Click the three dots (•••) at the end of any line in the detailed list view to open a drop-down list of actions you can perform on that asset.
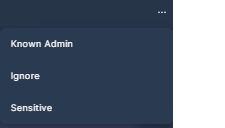
Fig 6. Action menu
- Set an asset as a Known Admin to ignore high privilege alerts and dynamic remediations on it. You can add a comment when confirming this status, for future reference
- Set an asset as Ignored to dismiss any alerts found on it. You can add a comment when confirming this status, for future reference
- Set an asset as Sensitive to prioritize any higher severity alerts on it.
Asset Details
Click on any row in the detailed list view to pop up additional information about that asset in a sideview window.
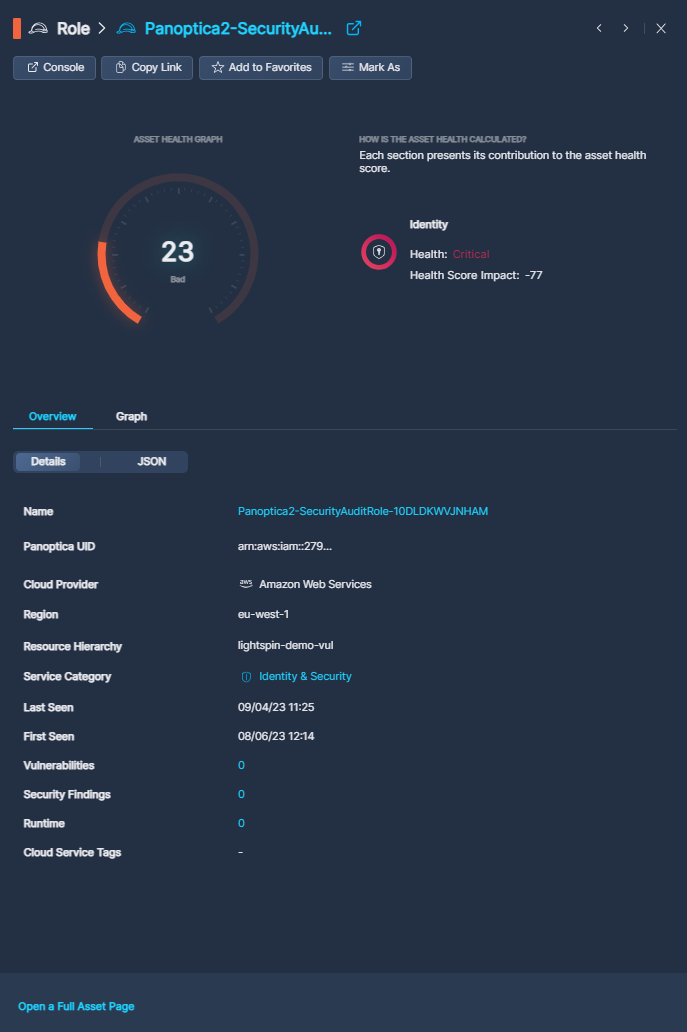
Fig 7. Asset Details
The buttons at the top of the pop-up window enable specific actions on that asset:
- Click Console to log into the relevant Service Provider account.
- Click Copy to retrieve a URL of the full asset page
- Click Add to Favorites to, well, add to favorites
- Click Mark as to label this asset as a Known Administrator, Sensitive, or Ignore it.
The Asset Health Graph helps you visualize the health score of your asset, including the current risk level and contribution to the total health score. To view the complete graph, however, you need to open the Full Asset Page, via the link at the bottom. See Asset Health Score for more information on asset health.
The Overview tab displays technical details, either in list view or in JSON format. Look for the Copy to clipboard icon to copy the JSON.
The Graph tab displays visual a representation of the asset's relationships: First Degree, Network, and Identity.
Full Asset Page
Click Full asset page below to view additional tabs related to this asset. Each tab displays an embedded view of the relevant information for this specific asset: Overview, Attack Paths, Vulnerabilities, Security Findings, Runtime, SBOM.
The Overview tab adds Identity and Network details to the General information provided on the previous screen.
An Attack Path is the flow of interconnected assets, accounts, identities, and/or permissions that an attacker can use to exploit a cloud environment. Learn more about this tab at Attack Path Analysis.
The Vulnerabilities tab lists any Common Vulnerabilities and Exposures (CVEs) that have been identified for this asset, if relevant. Click the sub-tabs to see the vulnerabilities broken down by those that are publicly exposed, those that are exploitable , and threat trends.
Panoptica enables you to gain a better understanding of the security issues and vulnerabilities that make up your Security Posture. From this tab, you can investigate vulnerabilities and remediate issues. Learn more about this tab at Security Posture
The Runtime tab provides information regarding Panoptica's runtime protection of your environment, as relates to this asset.
The SBOM tab provides a breakdown of the Software Bill of Materials, if relevant for the asset you have selected.
Updated 3 months ago