Data Inventory
The Data Inventory tab presents a dashboard-to-detail view of the data assets Panoptica has discovered in your environment. In addition to gaining aggregate insights, you can filter assets by a number of parameters; customize your search; arrange the display for simpler review; customize data labels, and drill down to explore detailed information about your data resources.
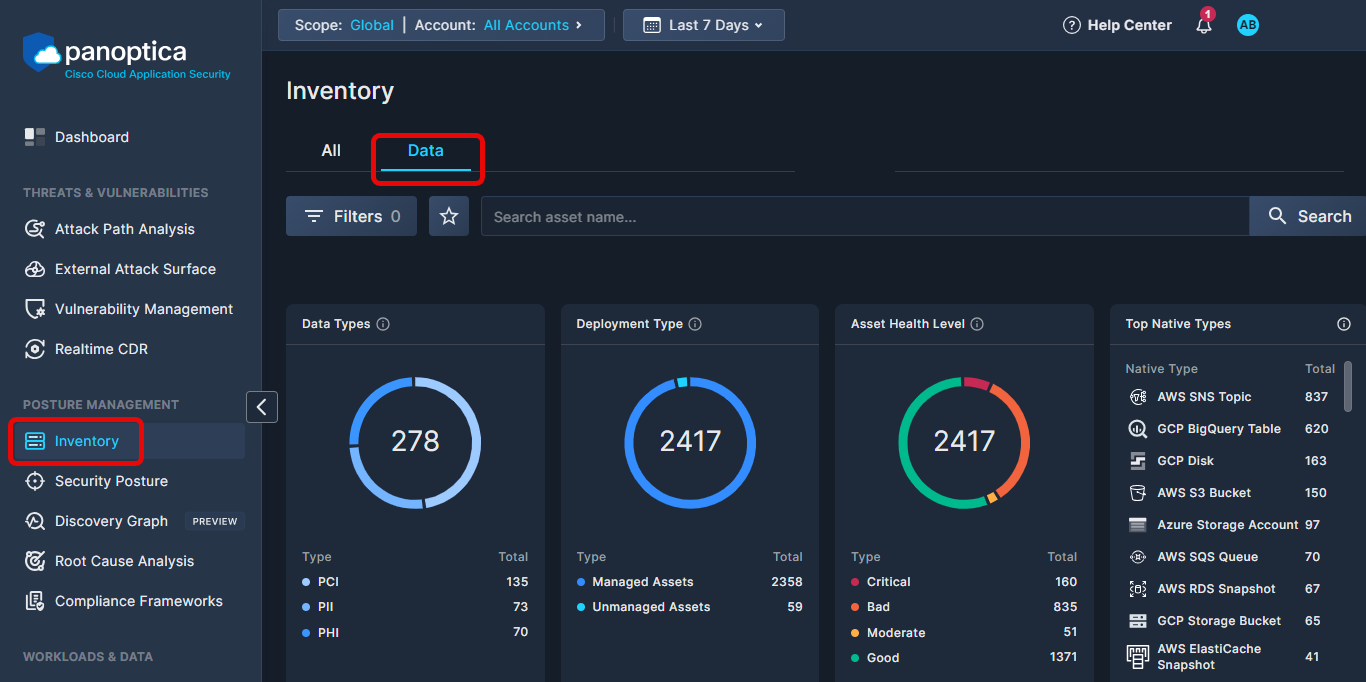
To reach the Data Inventory screen, go to the Inventory tab under Posture Management in the Panoptica console UI, and select the Data subtab.
You can also reach the Data Inventory subtab by clicking Go to Data Inventory on the Data Security tab. See Data Security for more details.
Filter and Search
Use the Top Bar Filter to narrow down the findings across the platform by Scope and Account using the drop-down lists at the top. You can also select the time frame during which the asset was last observed.

Top Bar Filter
You can further refine the results using predefined filters and open search.
- Use the drop-down Filters list to narrow the results by: Service, Provider, Service Category, Account, Risk Severity, User Actions, Labels, Data Type, Risk Engine, Insights, Region, Data Store, Deployment Model, and/or Data Volume.
- Use the Search bar to look for a text string in an Asset Name, Account name, or Service Category. To clear the search, click the ×.
Data Widgets
The Data Inventory dashboard displays four widgets that provide snapshot insights into the assets discovered in your environment, focusing on data type, deployment type, health level, and native types.
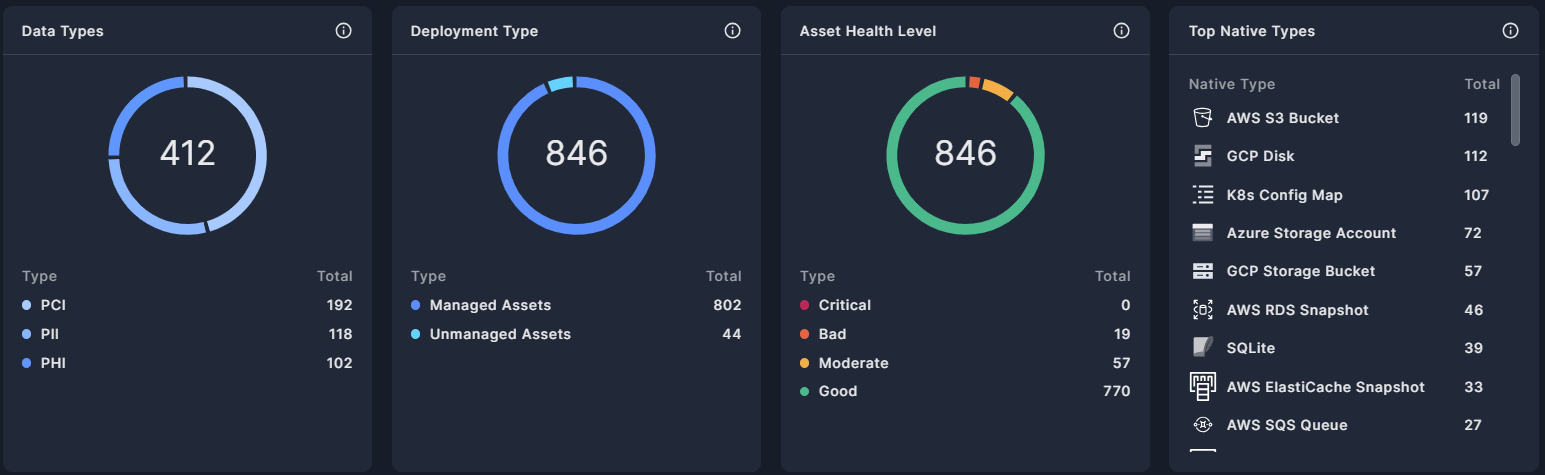
- Data Types - Pie graph indicating the number of assets identified as holding key sensitive data: financial information (PHI), personal information (PII), and health information (PHI).
- Deployment Type - Data assets can be either managed services, such as database services in cloud providers, or unmanaged applications, that are installed and administered by the end user. This pie graph display a breakdown of the managed versus unmanaged assets.
- Asset Health Level − The Asset Health Score is a value reflecting the health status of a certain asset − the higher the number, the better the health of the asset. This widget breaks down the discovered assets according to health score groups. Assets deemed Critical hold a score of 0-49; Bad asset are 50-70; Moderate are 71-85; assets deemed Good hold a score of: 86-100.
- Top Native Types - A breakdown of data assets by native type, the cloud vendors' original naming conventions.
Assets table
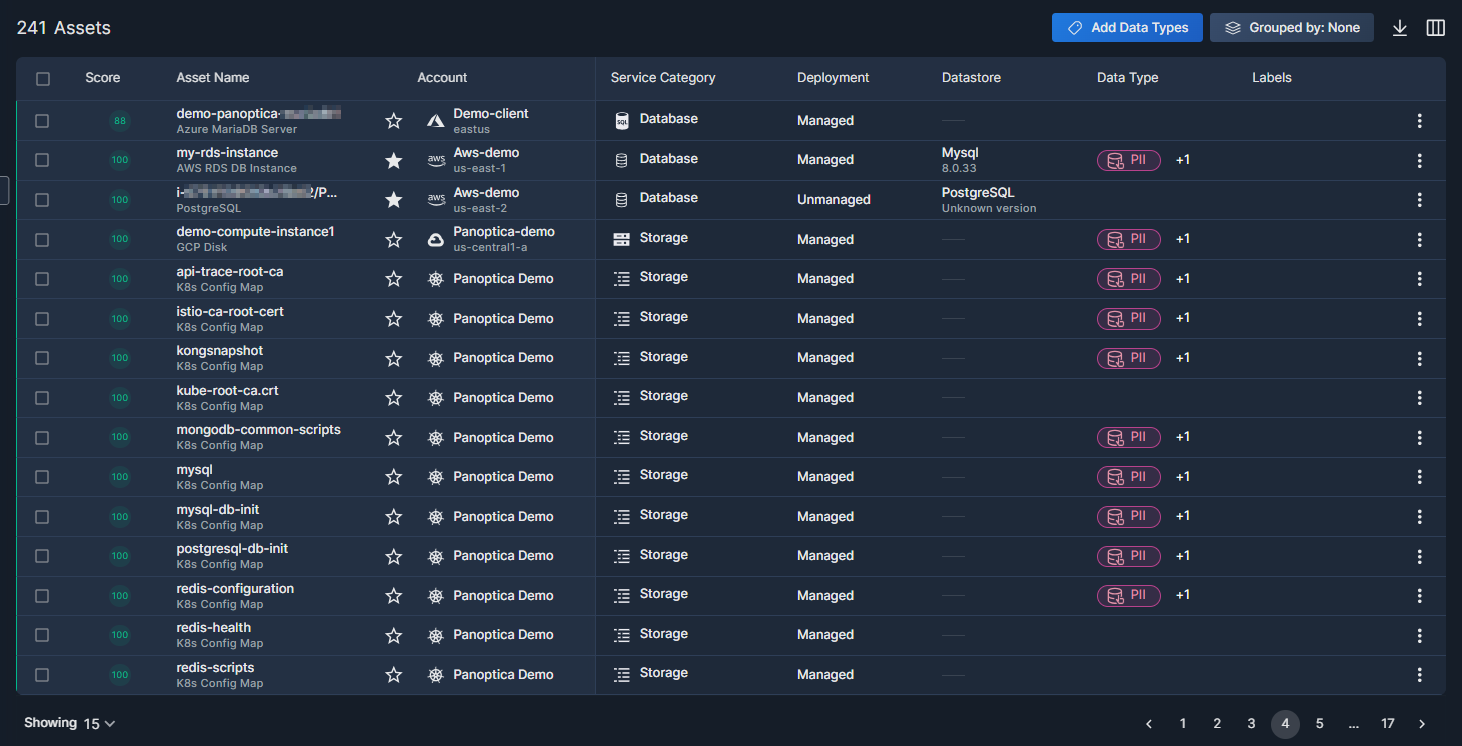
Below the widgets, Panoptica lists all the data assets discovered throughout your environment, displayed according to the filters and search parameters you defined.
-
The Assets table can be sorted according to all of its columns by clicking on the column header: Score, Asset Name, Account, Service Category, Deployment, Datastore, Data Type, and Labels.
-
Click the Grouped by button to aggregate the list according to Native Type, the cloud vendors' original naming conventions (i.e. AWS S3 Bucket).
-
Click the down arrow (↓) in the upper right corner of the table to Download the list of assets in JSON or CSV format.
-
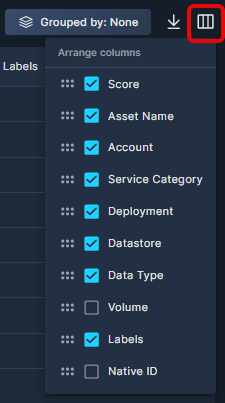
Select which columns are displayed, and in which order, by clicking the Arrange Columns button (▥).
Click the three dots (⁝) at the end of any record in the data asset view to open a drop-down list of actions you can perform on that asset.
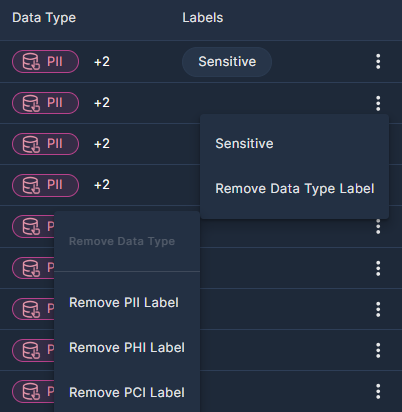
- Click Set Sensitivity to select the sensitivity level, in order to prioritize any higher severity alerts on it. See sensitivity levels for details.
- If you have defined Data Types, you can remove those by clicking Remove Data Type Label.
At the bottom of the screen you can configure how many records are displayed on each page, from 20 to 200 lines.
Data Types
Panoptica enables you to assign Data Types that further classify your sensitive information, to reduce the risk of data breaches and regulatory issues. There are three categories of Data Types:
- Personally Identifiable Information (PII)
- Protected Health Information (PHI)
- Payment Card Information (PCI)
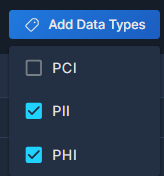
To add Data Type tags to a record in the Assets table, check the box at the beginning of the line to select it. You can select more than one row at a time. Then click Add Data Types and select whichever tag or tags you wish to add.
To remove a Data Type, click the three dots (⁝) at the end of the record, and select Remove Data Type Label. Data Type labels can only be removed one at a time.
Asset Details Drawer
Click on any row in the list of Data Assets to pop up additional information in a side drawer.
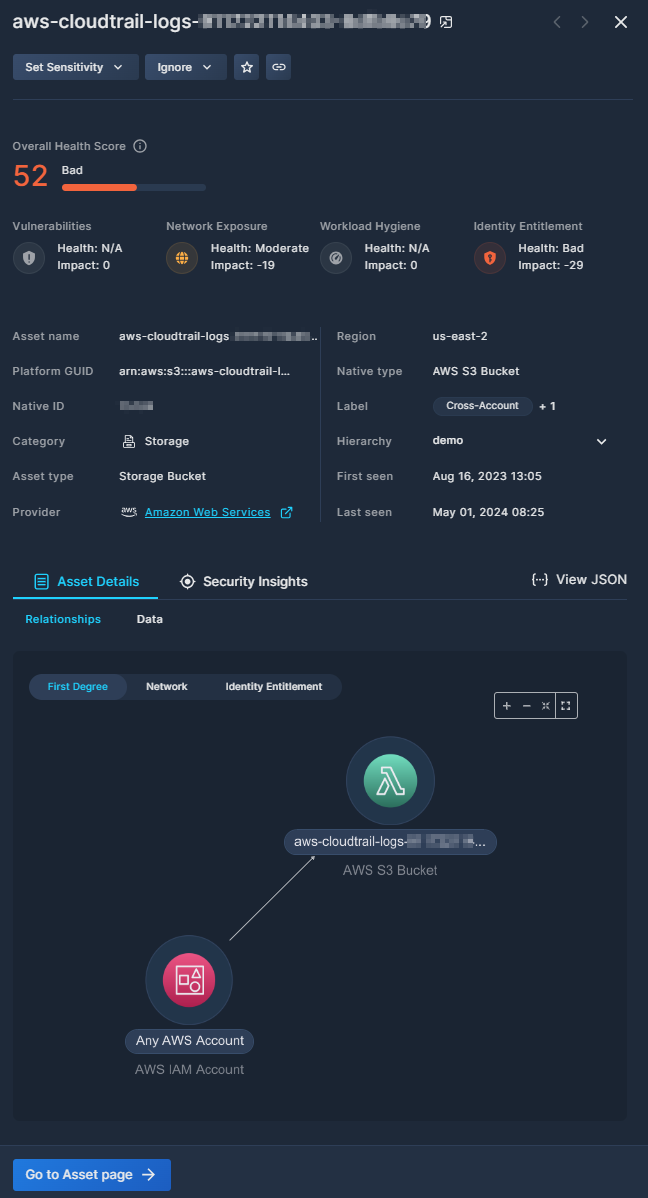
The buttons at the top of the pop-up window enable specific actions on that asset:
- Click Set Sensitivity to select the sensitivity level, in order to prioritize any higher severity alerts on it. See sensitivity levels for details.
- Mark an asset as a Known Admin to ignore high privilege alerts on it. You can add a comment when confirming this status, for future reference.
- Select Ignore to dismiss any alerts found on it. You can add a comment when confirming this status too, for future reference.
- Click Add to Favorites to, well, add to favorites.
- Click Copy link to retrieve a URL of the full asset page. This is useful for record keeping or sharing this information with others.
The Overall Health Score helps you visualize the health of this asset, presented on a scale from 0 to 100, where lower scores indicate potential security issues. The score is comprised of four aspects that impact an asset's security: Vulnerabilities, Network Exposure, Workload Hygiene, and Identity Entitlement. See Asset Health Score for more information on asset health.
Below the Overall Health Score, the side drawer displays far more details than those shown in the Asset Table, including Platform GUID, Native ID, Region, Resource hierarchy, and more. The Provider field is a link that opens a new tab to the service provider console, where you can explore the asset in context.
The Asset Details tab enables you to drill down even further into the asset's properties.
-
The Relationships subtab displays a graphical view of related assets, network architecture, and identity enablement
-
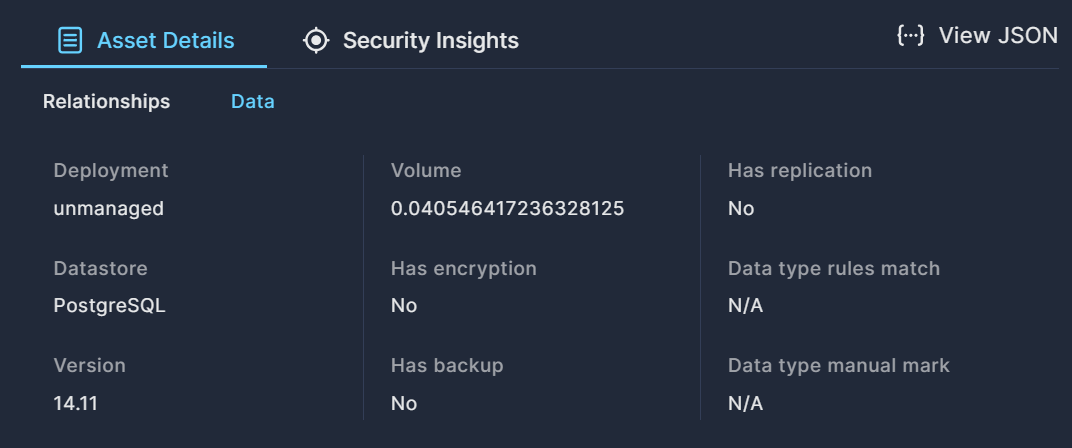
The Data subtab provides additional details regarding the data asset, such as deployment type, datastore, encryption status, etc.
Click View JSON to download the Asset Details in a JSON file.
The Security Insights tab provides an asset-centric view of the Attack Paths, Vulnerabilities, and Posture Risks associated with this asset.
Updated 10 months ago